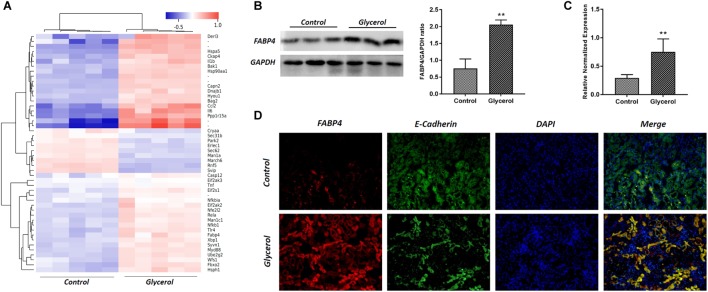
FIGURE 2.
Glycerol-induced the upregulation of FABP4 expression in kidney. (A) Hotmap of differentially expressed genes between control and glycerol group. (B) The kidney tissue lysates were subjected to Western blotting analysis with indicated antibodies against FABP4 and the expressions of FABP4 was quantified by densitometry and normalized with GAPDH. (C) FABP4 mRNA expression in renal tissue was measured by real-time PCR. (D) Immunofluorescence staining of FABP4 and E-cadherin in the kidney tissue. E-cadherin was used as a marker of tubular epithelial cells. ∗∗P < 0.01.

