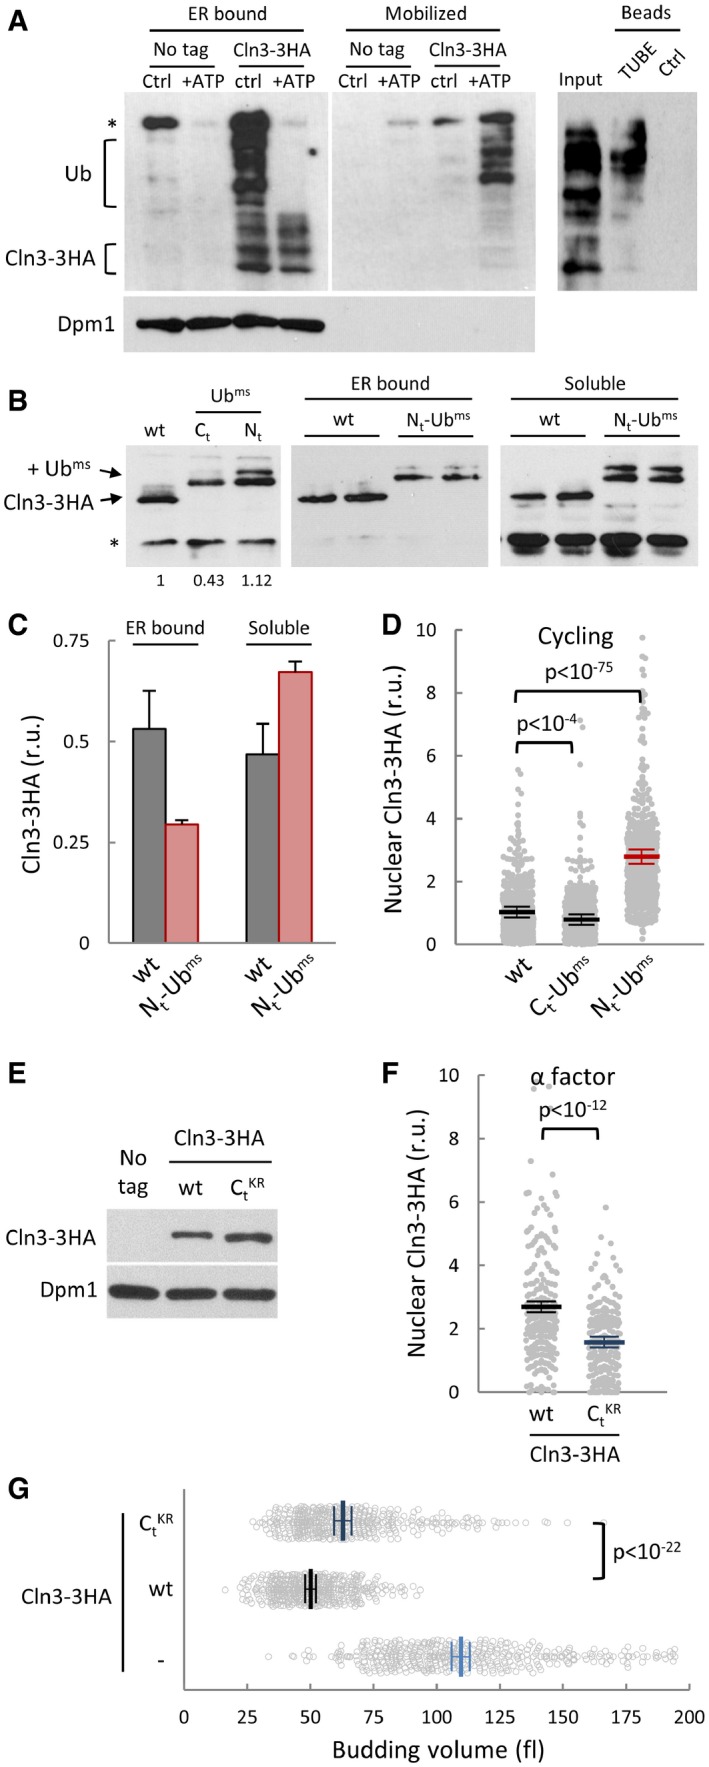
Figure 3. Cln3 is released from the ER by ubiquitination.

- Cell extracts from ydj1∆ CLN3‐3HA cells were complemented with 10 ng/μl purified Ydj1 protein and incubated for 30 min at 25°C (Ctrl) or in the presence of an ATP‐regeneration system (+ATP). Membrane (left panel) and mobilized soluble (middle panel) fractions were obtained to quantify released levels of Cln3‐3HA by immunoblotting. A high‐molecular‐weight αHA cross‐reacting band is marked (*), and Dpm1, an ER‐membrane protein, is shown as control for release specificity. Mobilized soluble fraction (Input) was added to either ubiquitin‐binding (TUBE) or control (Ctrl) beads and bound proteins analyzed by immunoblotting (right panel). High‐molecular‐weight species corresponding to ubiquitinated Cln3‐3HA are indicated (Ub).
- Protein levels of wild‐type Cln3‐3HA and monomeric stable ubiquitin (Ubms, see text for details) fusions at the N‐terminus (Nt‐Ubms) or C‐terminus (Ct‐Ubms) of Cln3‐3HA were analyzed by immunoblotting (left panel). A low‐molecular‐weight αHA cross‐reacting band is marked (*). Membrane (middle panel) and soluble (right panel) fractions were obtained to quantify levels of wild type and Nt‐Ubms Cln3‐3HA by immunoblotting.
- Quantification of wild‐type and Nt‐Ubms Cln3‐3HA levels from immunoblot analysis as in (B). Mean values (N = 3) and confidence limits (α = 0.05) for the mean are shown.
- Nuclear accumulation of wild‐type, Ct‐Ubms, and Nt‐Ubms Cln3‐3HA in individual cycling cells was analyzed by immunofluorescence as in Fig 2E. Relative mean values (N = 500, thick horizontal lines), confidence limits (α = 0.05, thin lines) for the mean, and P‐values obtained from t‐tests are also shown.
- Protein levels of 3HA‐tagged wild‐type and a KR substitution mutant in the last 180 () amino acids of Cln3 were analyzed by immunoblotting. Dpm1 is shown as a loading control.
- Nuclear accumulation of wild type and Cln3‐3HA in individual cells arrested in late G1 with α factor was analyzed by immunofluorescence as in Fig 2E. Relative mean values (N > 200, thick horizontal lines), confidence limits (α = 0.05, thin lines) for the mean and P‐values obtained from t‐tests are also shown.
- Individual volumes at budding of cln3 cells expressing wild type or Cln3‐3HA or none. Mean values (N > 400, thick vertical lines), confidence limits (α = 0.05, thin lines) for the mean, and P‐values obtained from t‐tests are also shown.
Source data are available online for this figure.
