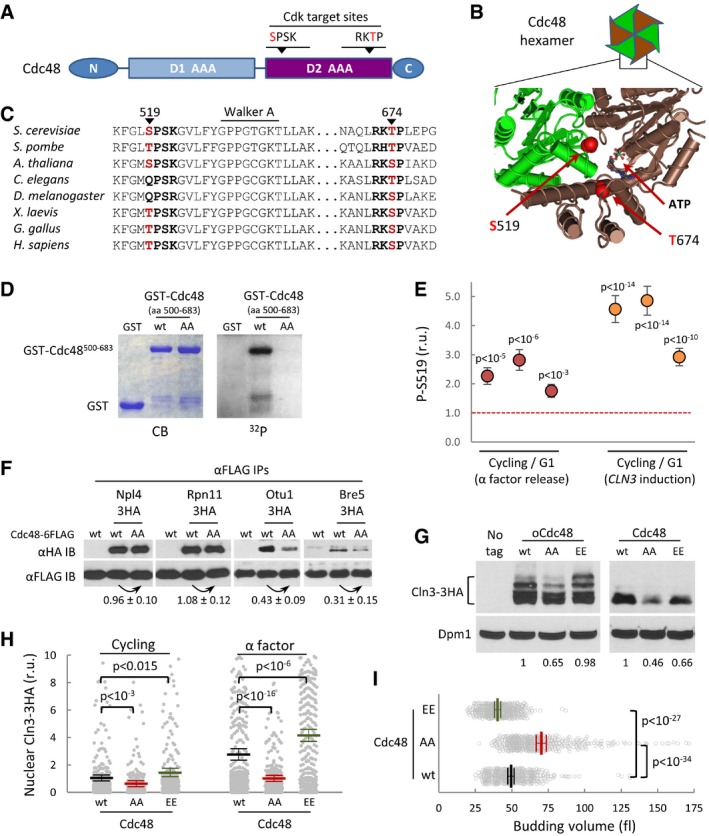
Figure 6. Cdc48 is regulated by Cdk phosphorylation.

- Schematic representation of the Cdc48 protein, with special reference to the position of two Cdk phosphosites within the second AAA‐ATPase domain (D2).
- Spatial location of S519 and T674 Cdk phosphosites at the D2 interface of two monomers in the Cdc48 hexameric ring (PDB 3CF1).
- Amino acid sequence alignment of the Cdk phosphosite regions of Cdc48 from various organisms ranging from yeast to mammals.
- In vitro kinase assay of wild‐type and double S519A T674A mutant (AA) yeast Cdc48. Specified GST fusions were incubated with Cdk4‐cyclin D1 in the presence of [γ32P]‐ATP, subsequently analyzed by SDS–PAGE, and stained (CB) or detected by autoradiography (32P).
- Phosphorylation levels of S519 in vivo by mass spectrometry analysis. Cycling and G1 cells obtained with α factor (red circles) or by G1‐cyclin depletion and CLN3 induction (orange circles) were used to determine relative S519 phosphorylation levels as described under Materials and Methods, and obtained ratios for three independent experiments are plotted. Error bars correspond to the standard deviation estimated from measurements of control peptide ratios in individual samples (N = 3). The null hypothesis of a true ratio equal to 1 was tested and the resulting P‐values are indicated assuming that control and problem peptide ratios are homoscedastic and normally distributed.
- αFLAG immunoprecipitates (αFLAG IP) of cells expressing wild‐type (wt) or non‐phosphorylatable (AA) Cdc48‐6FLAG and the indicated HA‐tagged Cdc48 cofactors were analyzed by immunoblotting with either αHA or αFLAG antibodies. Co‐immunoprecipitated levels of the analyzed cofactors were made relative to immunoprecipitated wild‐type or non‐phosphorylatable Cdc48‐FLAG, and numbers indicate the mean (N = 3) fold change found in non‐phosphorylatable relative to wild‐type Cdc48 samples. Confidence limits for the mean (α = 0.05) are also indicated.
- Cln3‐3HA levels in cells expressing wild‐type (wt), non‐phosphorylatable (AA), or phosphomimetic (EE) Cdc48 proteins at endogenous levels or from the GAL1p promoter as in Fig 2B. Dpm1 is shown as a loading control. Relative levels of Cln3‐3HA quantified from the image are indicated at the bottom.
- Nuclear accumulation of Cln3‐3HA in individual cells expressing wild‐type (wt), non‐phosphorylatable (AA), or phosphomimetic (EE) Cdc48 proteins at endogenous levels. Immunofluorescence analysis was performed in cycling or late‐G1 arrested cells as in Fig 2E. Relative mean values (N > 275, thick horizontal lines), confidence limits (α = 0.05, thin lines) for the mean and P‐values obtained from t‐tests are also shown.
- Individual volumes at budding of cells expressing wild‐type (wt), non‐phosphorylatable (AA), or phosphomimetic (EE) Cdc48 proteins at endogenous levels. Mean values (N = 450, thick vertical lines), confidence limits (α = 0.05, thin lines) for the mean, and P‐values obtained from t‐tests are also shown.
Source data are available online for this figure.
