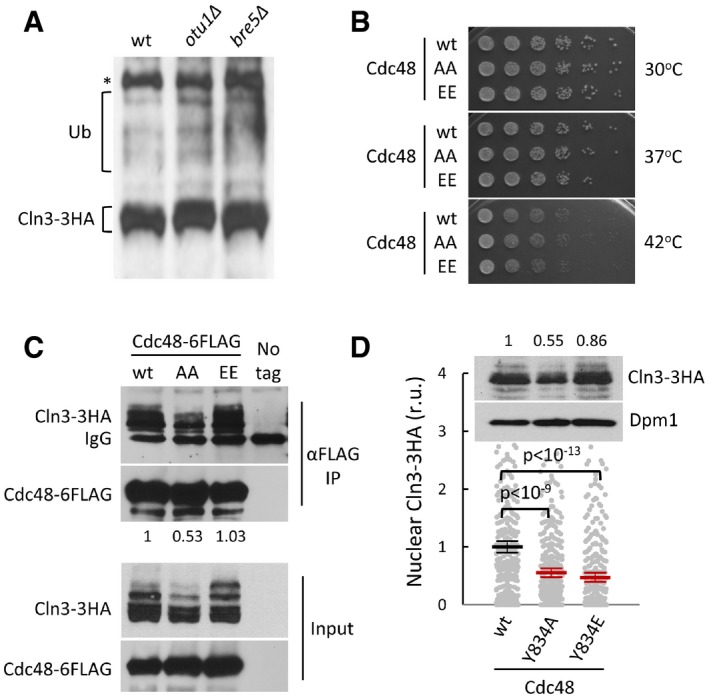
Figure EV6. Cln3 fate and Cdc48 phosphorylation mutant proteins.

- Cell extracts from wild‐type, otu1∆ and bre5∆ cells expressing CLN3‐3HA were analyzed by immunoblotting. High‐molecular‐weight species corresponding to ubiquitinated Cln3‐3HA are indicated (Ub). A high‐molecular‐weight αHA cross‐reacting band is marked (*).
- Cells expressing wild‐type (wt), non‐phosphorylatable (AA), or phosphomimetic (EE) Cdc48 proteins at endogenous levels were diluted, spotted onto YPD plates and grown at 30, 37 or 42°C.
- Cell extracts (Input) and αFLAG immunoprecipitates (αFLAG IP) of cells expressing Cln3‐3HA and wild‐type (wt), non‐phosphorylatable (AA), or phosphomimetic (EE) Cdc48‐6FLAG proteins from the GAL1p promoter as in Fig 6G (same experiment) were analyzed by immunoblotting with either αHA or αFLAG antibodies. The αFLAG heavy chain (IgG) band is also marked. Indicated numbers refer to the relative levels of Cln3‐3HA in immunoprecipitated samples as quantified from image.
- Nuclear accumulation of Cln3‐3HA in individual cells expressing wild‐type (wt), tyrosine non‐phosphorylatable (Y834A), or tyrosine phosphomimetic (Y834E) Cdc48 proteins at endogenous levels. Immunofluorescence analysis was performed in cycling cells as in Fig 2E. Relative mean values (N > 275, thick horizontal lines), confidence limits (α = 0.05, thin lines) for the mean, and P values obtained from t‐tests are also shown. An immunoblot showing overall levels of Cln3‐3HA in cells from this experiment is shown at the top and relative amounts are indicated. Dpm1 was detected as loading control.
Source data are available online for this figure.
