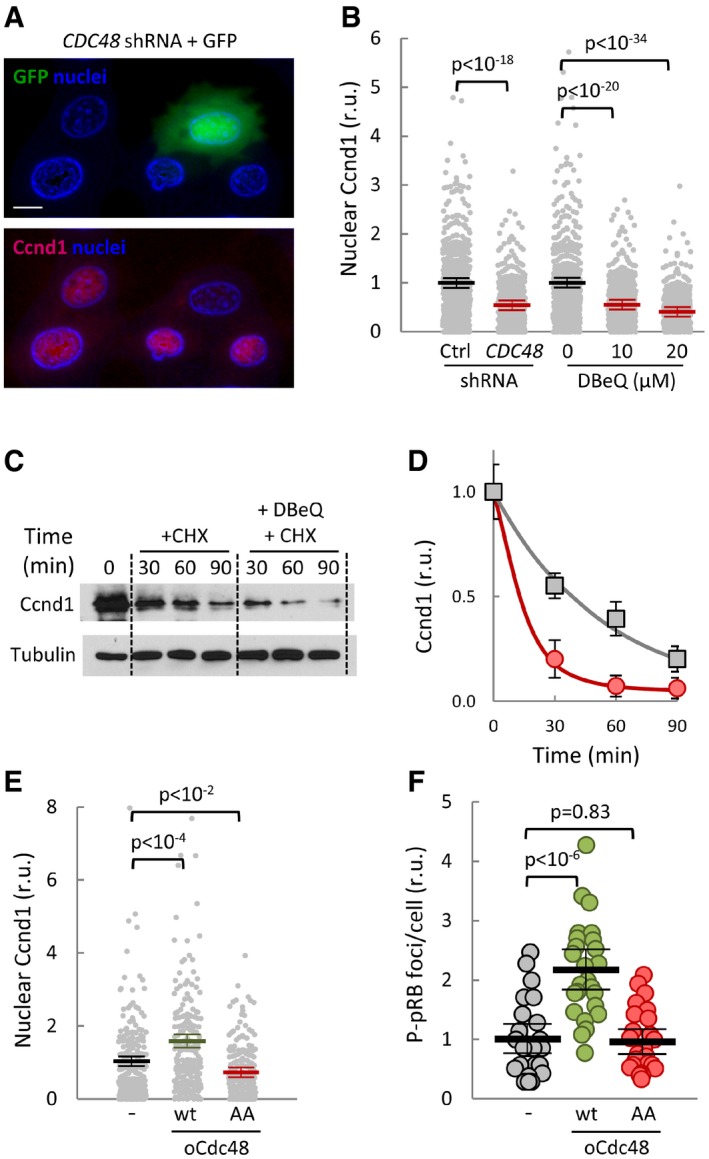
Figure 7. Cdc48 also controls stability and nuclear functions of cyclin D1 in mammalian cells.

- Immunofluorescence analysis of cyclin D1 (Ccnd1, red signal) in mouse 3T3 cells transfected with Cdc48 shRNA. GFP (green) was used as a transfection reporter. A first‐derivative image of Hoechst‐stained nuclei (blue) is shown to enhance nuclear limits. Scale bar, 5 μm.
- Quantification of Ccnd1 nuclear levels in 3T3 cells transfected with control (Ctrl) or Cdc48 shRNAs, or treated with the indicated concentrations of DBeQ for 90 min. Values were made relative to the average obtained from untreated cells. Mean values (N > 350, thick horizontal lines), confidence limits (α = 0.05, thin lines) for the mean, and P‐values obtained from t‐tests are also shown.
- After being treated with or without 20 μM DBeQ, cells were added cycloheximide and collected at the indicated times to determine Ccnd1 levels. Tubulin is shown as a loading control.
- Quantification of Ccnd1 stability in control (squares) and DBeQ‐treated (circles) cells from immunoblot analysis as in (C) at the indicated times after cycloheximide addition. Mean values (N = 3) and confidence limits (α = 0.05) for the mean are shown.
- Nuclear accumulation of Ccnd1 in 3T3 cells overexpressing wild‐type (wt) or non‐phosphorylatable (AA) Cdc48, or none as control. Values were made relative to the average obtained from control cells. Mean values (N > 200), confidence limits, and P‐values are as in (B).
- Nuclear P‐S780‐pRB foci number in 3T3 cells overexpressing wild‐type (wt) or non‐phosphorylatable (AA) Cdc48, or none as control. Values were made relative to the average obtained from control cells. Mean values (N = 25, thick horizontal lines), confidence limits (α = 0.05, thin lines) for the mean, and P‐values obtained from t‐tests are also shown.
Source data are available online for this figure.
