-
A
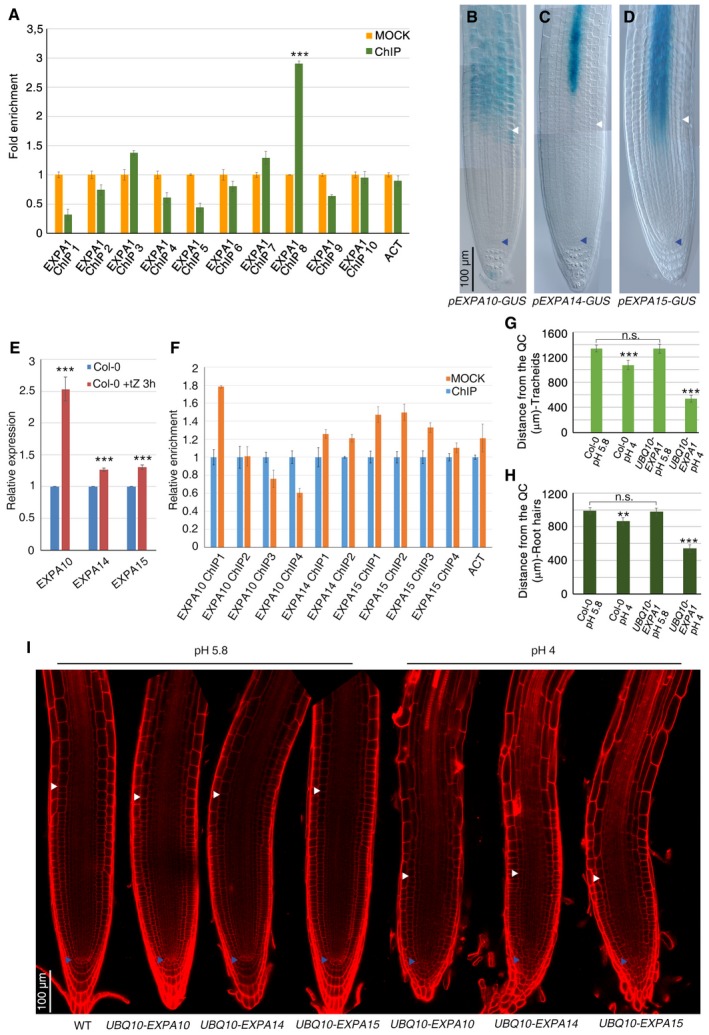
EXPA1 fold enrichment deriving from ChIP‐qPCR analysis performed on immunoprecipitated chromatin of pARR1::ARR1:GFP roots (***P < 0.001; Student's t‐test; two technical replicates performed on two independent DNA batches).
-
B–D
DIC microscopy images of WT roots expressing pEXPA10‐GUS (B), pEXPA14‐GUS (C), and pEXPA15‐GUS (D) constructs, respectively.
-
E
qRT–PCR analysis of EXPA10, EXPA14, and EXPA15 mRNA levels in the root tip of WT plants upon cytokinin treatment (***P < 0.001; Student's t‐test; three technical replicates performed on two independent RNA batches).
-
F
EXPA10, EXPA14, and EXPA15 fold enrichment deriving from ChIP‐qPCR analysis performed on immunoprecipitated chromatin of pARR1::ARR1:GFP roots. (Two technical replicates performed on two independent DNA batches)
-
G, H
Measurements of tracheids (G) and root hairs (H) distance from the QC in WT and UBQ10‐EXPA1 root tips grown on standard (5.8) or acidic (4.0) pH. (n = 10. **P < 0.01, ***P < 0.001; Student's t‐test).
-
I
Confocal microscopy images of WT (n = 10) root tips grown on standard (5.8) pH and of UBQ10‐EXPA10 (n = 15), UBQ10‐EXPA14 (n = 20), and UBQ10‐EXPA15 (n = 15) root tips grown on standard (5.8) or acidic (4.0) pH.
Data information: In (A–I), experiments were performed on seedlings at 5 dpg. Blue and white arrowheads indicate the QC and the cortex TB, respectively. Error bars indicate SD.

