
Figure 4. AHA1‐ and AHA2‐dependent apoplast acidification activates EXPA1 and induces cell differentiation.
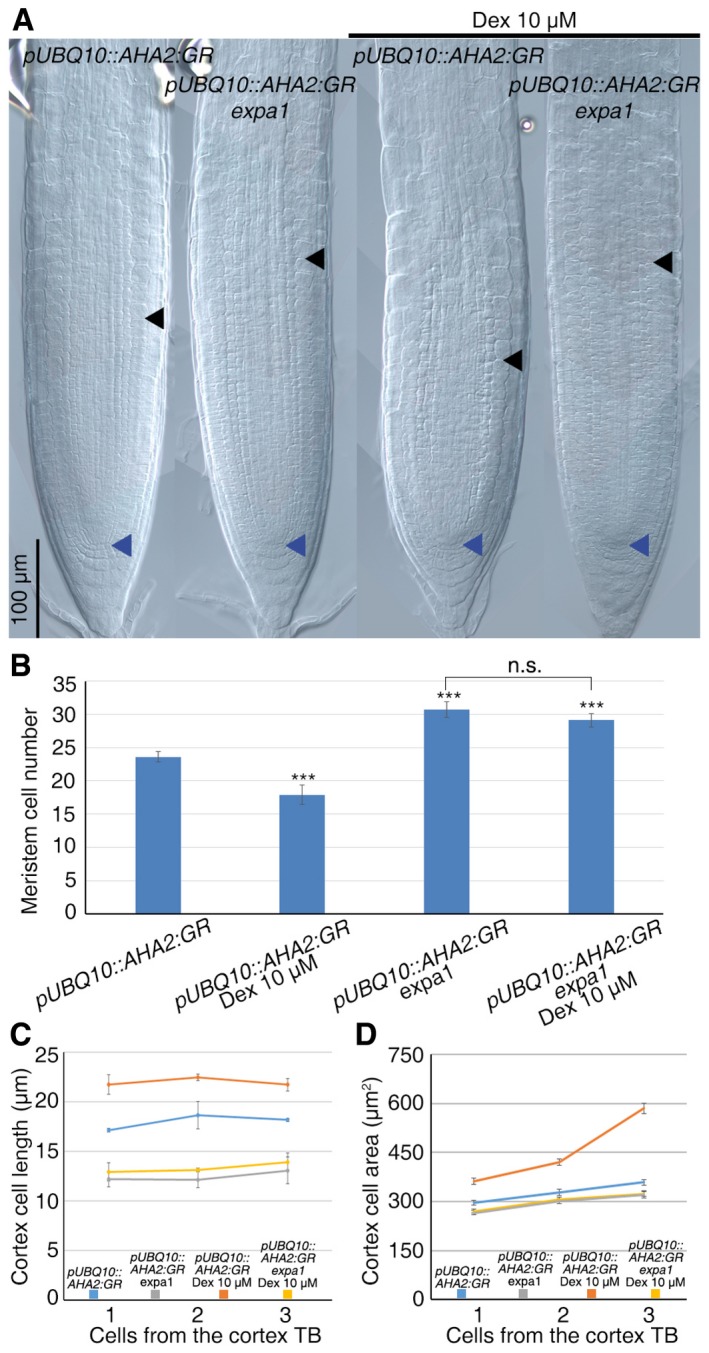
- DIC microscopy images of WT and expa1 roots expressing the pUBQ10::AHA2:GR construct treated and untreated with Dex. Blue and black arrowheads indicate the QC and the cortex TB, respectively.
- Measurement of meristem cell number of roots depicted in a (n = 30. For statistical analysis, untreated pUBQ10::AHA2:GR was set as reference. ***P < 0.001, n.s. corresponds to not significant; Student's t‐test).
- Measurement of cell length of newly differentiated cortex cells of root depicted in (A) (n = 15).
- Measurement of cell area of newly differentiated cortex cells of root depicted in (A) (n = 15).