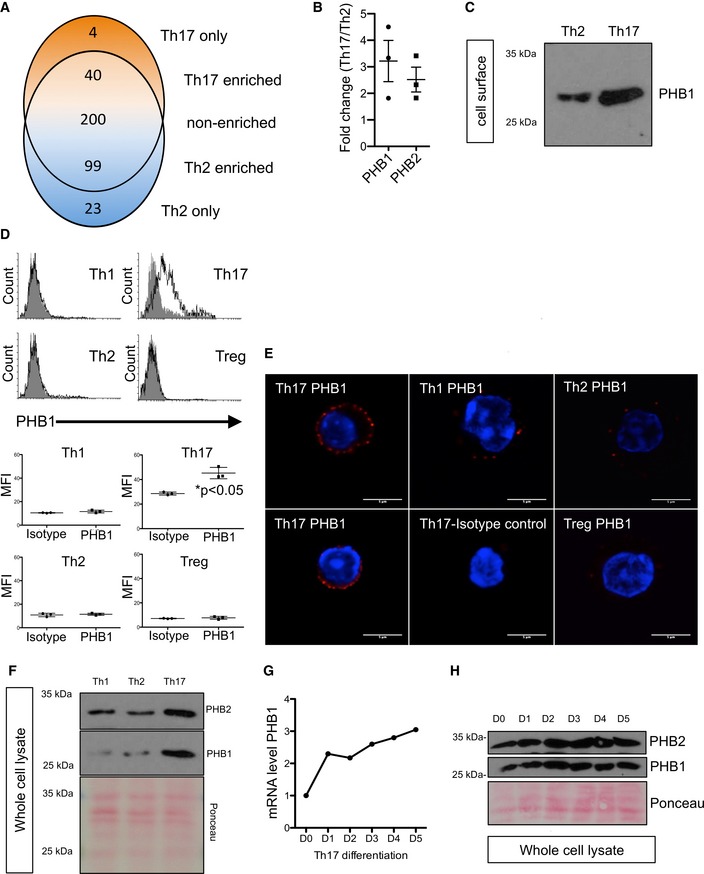
Venn diagram showing overlap between proteins identified in the surface biotinylation experiments. Shown are short listed factors that are consistently detected in three biological replicates (n = 3 healthy human donors). The 366 proteins identified in both cell types are split into proteins showing at least twofold higher abundance in Th17 cells, proteins with a log2 ratio between −1 and 1 (considered as non‐cell type specific) and proteins with at least twofold higher abundance in Th2 cells.
Graphical presentation of the calculated fold‐change values for prohibitin‐1 (PHB1) and prohibitin‐2 (PHB2) based on label‐free quantification results from three biological replicates, shown as mean (± SEM).
Surface biotinylation of murine Th2 and Th17 cells was performed, and the surface expression of PHB1 was checked by immunoblots.
Th1, Th2, Th17 and Treg cells were stained for PHB1 expression. Isotype antibody was used as a control (filled histogram). MFI (mean fluorescence intensity) is shown as mean (± SEM); n = 3 animals per group.
Cells were treated and stained with Alexa594‐conjugated secondary antibody. Red signal indicates surface expression of PHB1 in Th17, Th1 and Th2 cells; the nucleus was stained (blue) with Hoechst. Scale bar = 5 μm.
The expression levels of PHB1 and PHB2 in the murine whole‐cell lysates were analysed by immunoblots. PHB1 and PHB2 are highly expressed in Th17 cells.
The expression analysis of PHB1 mRNA levels reveals a steady increase during the course of Th17 cell differentiation. Shown are the data from a single representative experiment.
CD4+ T cells subjected to Th17 differentiation were lysed on indicated days, and the levels of PHB1 and PHB2 total protein were monitored by immunoblots.
Data Information: In (F) and (H), Ponceau staining of the entire membrane was performed to monitor loading of proteins.

