-
A, B
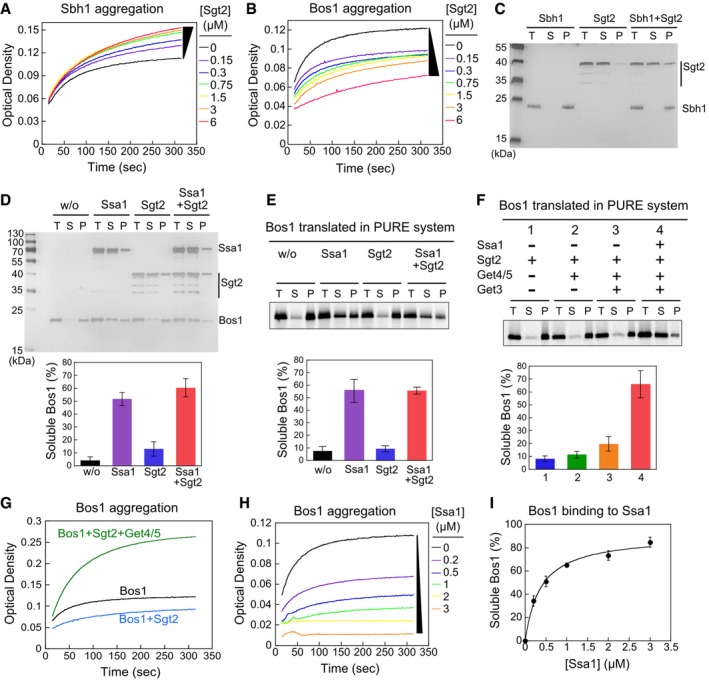
Time courses of Sbh1 (A) and Bos1 (B) aggregation measured by the turbidity assay.
-
C, D
Sedimentation analysis of recombinant Sbh1 (C) and Bos1 (D). 1.5 μM Sbh1 or Bos1 was incubated in assay buffer with or without the indicated factors and ultracentrifuged at 390,880 g for 30 min. Total input (T), soluble (S), and pellet (P) fractions were resolved by SDS–PAGE and visualized by silver stain. 1.5 μM Sgt2 was used in (C), and 3 μM Ssa1 and/or Sgt2 was used in (D) where indicated. The lower panel in (D) shows quantification of soluble Bos1.
-
E, F
Sedimentation analysis of 35S‐labeled Bos1 synthesized by PURE‐IVT. Where indicated, translations reactions were supplemented with 0.5 μM Sgt2, 0.25 μM Get4/5, 0.75 μM Get3, and/or 3 μM Ssa1. The lower panels show quantification of soluble Bos1 under the indicated reaction conditions.
-
G
Get4/5 exacerbates Bos1 aggregation in the turbidity assay. Reactions used 1.5 μM recombinant Bos1, 1.5 μM Sgt2 without (blue) and with (green) 1.5 μM Get4/5 present.
-
H
Time courses of Bos1 aggregation in the presence of Ssa1.
-
I
Ssa1 solubilizes Bos1 in a dose‐dependent manner. The line was a fit of the data to equation
(1).
= 3–4.