
Figure EV2. Ssa1 that co‐purified with Sgt2 in the His6‐pull‐down assay accounted for < 17% of Sgt2‐associated TA.
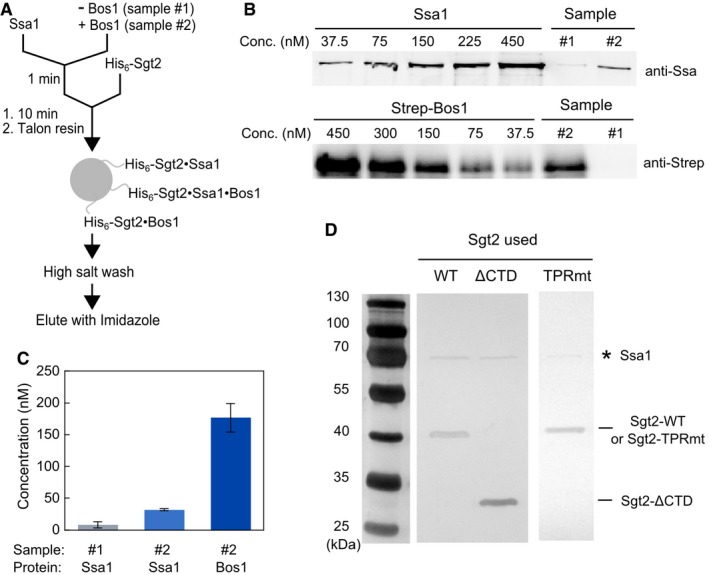
- Scheme of the His6‐Sgt2 pull‐down assay to monitor TA loading onto Sgt2 used for the experiments in Fig 4C. 5 μM Ssa1 and 2 mM ATP were pre‐incubated in the absence (sample #1) or presence (sample #2) of 300 nM Strep‐Bos1 for 1 min, and further incubated for 10 min after addition of 500 nM His6‐Sgt2. The mixture was incubated with Talon resin at 4°C for 10 min. All three possible complexes that can be immobilized on the resin via His6‐Sgt2 are depicted. After washing the resin with high‐salt (500 mM NaCl) buffer, bound proteins were eluted with 300 mM imidazole.
- Quantitative Western blot analysis of the amount of Ssa1 and Bos1 in the elution fractions from samples #1 and #2 in (A), using known concentrations of purified Ssa1 and strep‐Bos1. Proteins were detected with their corresponding secondary antibodies labeled with IRDye.
- Quantified concentrations of Ssa1 and Bos1 that co‐purified with Sgt2 in the elution fractions: 8.2 nM Ssa1 in the absence of Bos1 (sample #1), and 32 nM Ssa1 and 180 nM Bos1 in the presence of Bos1 (sample #2). Values are reported as mean ± SD, with n ≥ 2.
- Silver‐stained images of Sgt2·TA complexes reconstituted and purified as in panel (A) for wild‐type and mutant Sgt2. * denotes the Ssa1 band. Note that this gel was overdeveloped to visualize the presence of Ssa1.
Source data are available online for this figure.