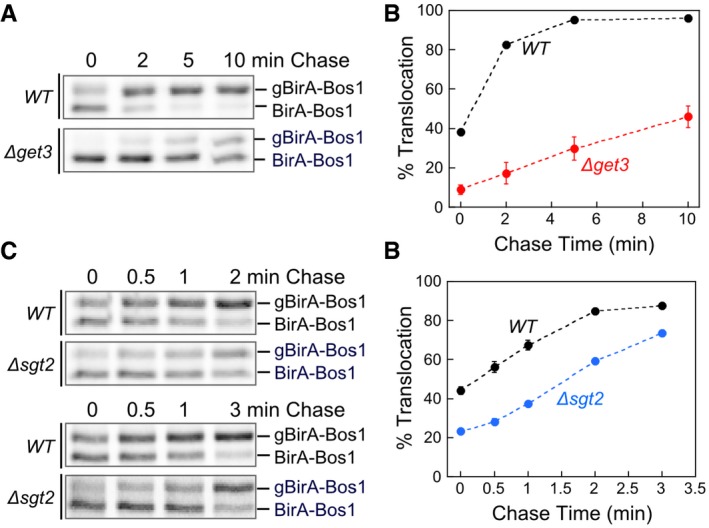
Representative autoradiograms for pulse‐chase analysis of the translocation of metabolically labeled BirA‐Bos1 in WT (black) and ∆get3 (red) cells.
Quantification of the data in (A) and replicates.
Representative autoradiograms for pulse‐chase analysis of the translocation of metabolically labeled BirA‐Bos1 in WT (black) and ∆sgt2 (blue) cells.
Quantification of the data in (C) and replicates.
Data information: Values in (B) and (D) are mean ± SD, with
n = 2 (biological replicates). Error bars are shown but may not be visible in some cases.

