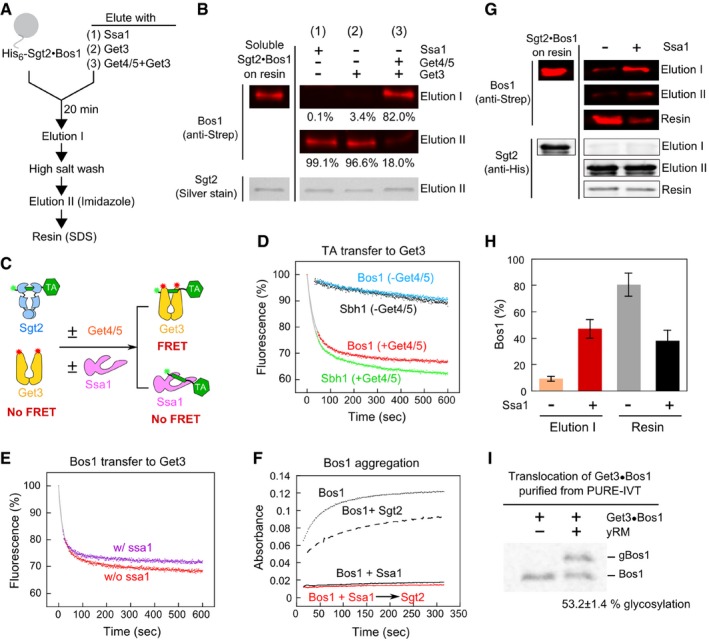
Figure 5. Ssa1 enables efficient and unidirectional TA transfer to Sgt2 and then to Get3, and this stepwise transfer ensures the solubility and targeting competence of TAs.

- Schematic of on‐bead TA transfer from Sgt2 to Ssa1 or Get3. Reconstituted Sgt2·Bos1 complex was immobilized on metal affinity resin as shown in Appendix Fig S2. After incubation with 3 μM Ssa1 (reaction 1), 2 μM Get3 (reaction 2), or 2 μM Get3 and 1 μM Get4/5 (reaction 3) for 20 min, Elution I was collected. After extensive washes with high salt (500 mM NaCl)‐containing assay buffer, the proteins that remain bound to the resin were eluted with imidazole (Elution II). For the experiment in (G), aggregated proteins irreversibly bound to the resin were further released with SDS (resin). All reactions contained 2 mM ATP.
- Elution fractions from the reactions in (A) were resolved by SDS–PAGE and visualized by Western blot (against strep‐Bos1) and silver stain (for Sgt2). The numbers denote %Bos1 in each fraction. To estimate the total amount of soluble Sgt2·Bos1 complex (first column), the resin was directly eluted with imidazole‐containing buffer without Elution I.
- Scheme of the FRET‐based transfer assay to monitor TA transfer from Sgt2 to Get3. Green and red asterisks denote donor and acceptor dyes, respectively.
- Time courses of TA transfer from Sgt2 to Get3 in the presence and absence of Get4/5. The transfer reactions were initiated by addition of 200 nM Get3ATTO, 2 mM ATP in the absence and presence of 200 nM Get4/5. Grey lines are fits of the data to equation (4). The fluorescence in the absence of transfer (100%) was determined prior to addition of Get3 and Get4/5.
- Time courses of TA transfer from Sgt2 to Get3, measured using the FRET assay in (C), in the presence and absence of 3 μM Ssa1. The transfer reaction was initiated by addition of a mixture of 500 nM Get3BFL, 500 nM Get4/5, and 2 mM ATP to 200 nM preformed Sgt2·Bos1CM, and donor fluorescence was monitored over time. The grey lines are fits of the data to equation (4).
- Solubility of Bos1 mixed with Ssa1 (3 μM) before (black) and after (red) addition of 1.5 μM Sgt2. The dotted and dashed lines are Bos1 alone and Bos1 directly mixed with Sgt2, respectively.
- Sgt2·Bos1 complexes reconstituted in the absence and presence of Ssa1 were analyzed for the efficiency of TA transfer to Get3 as outlined in (A). In Elution I, Sgt2·Bos1 immobilized on metal affinity resin was eluted with 2 μM Get3 and 1 μM Get4/5 in the presence of 2 mM ATP. Elution I, Elution II, and Resin fractions were resolved by SDS–PAGE and visualized by Western blot against Strep‐Bos1 and His6‐Sgt2. To estimate the total amount of immobilized Sgt2·Bos1 (first column), the resin was directly eluted with SDS.
- Quantification of the data in (G) and replicates. %Bos1 in both Elution I and Resin fractions was quantified, and values are reported as mean ± SD, with n = 3.
- Representative autoradiograph of TA insertion reactions with Get3·Bos1 generated and purified from chaperone‐supplemented PURE‐IVT. 35S‐labeled Bos1 was synthesized by PURE‐IVT in the presence of 6 μM Ssa1, 0.5 μM Sgt2, 0.5 μM Get4/5, and 0.75 μM Get3‐FLAG. The Get3·Bos1 complex was purified using anti‐FLAG magnetic beads and presented to 3 μl yeast rough microsomes (yRM) in a total reaction volume of 15 μl. Translocation efficiency was reported below the image (mean ± SD, n = 3).
