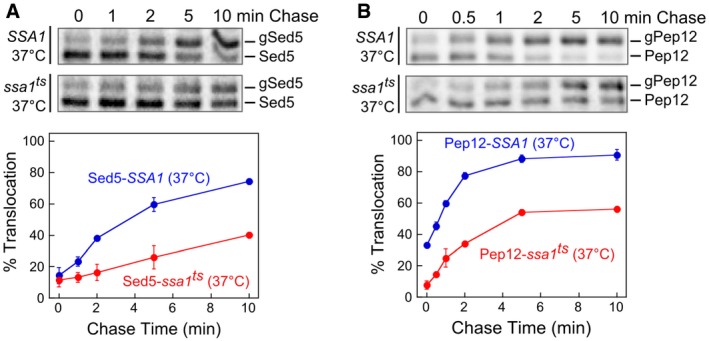
Figure EV5. Ssa1 facilitates the targeting of multiple GET‐dependent TAs to the ER.

-
A, BThe top panels show representative autoradiograms for pulse‐chase analysis of the translocation of metabolically labeled Sed5 (A) and Pep12 (B) in SSA1 (blue) and ssa1 ts (red) cells at 37°C. The bottom panels show the quantifications of translocation efficiencies at indicated time points. All values are mean ± SD, with n = 2 (biological replicates). Error bars are shown but may not be visible in some cases.
