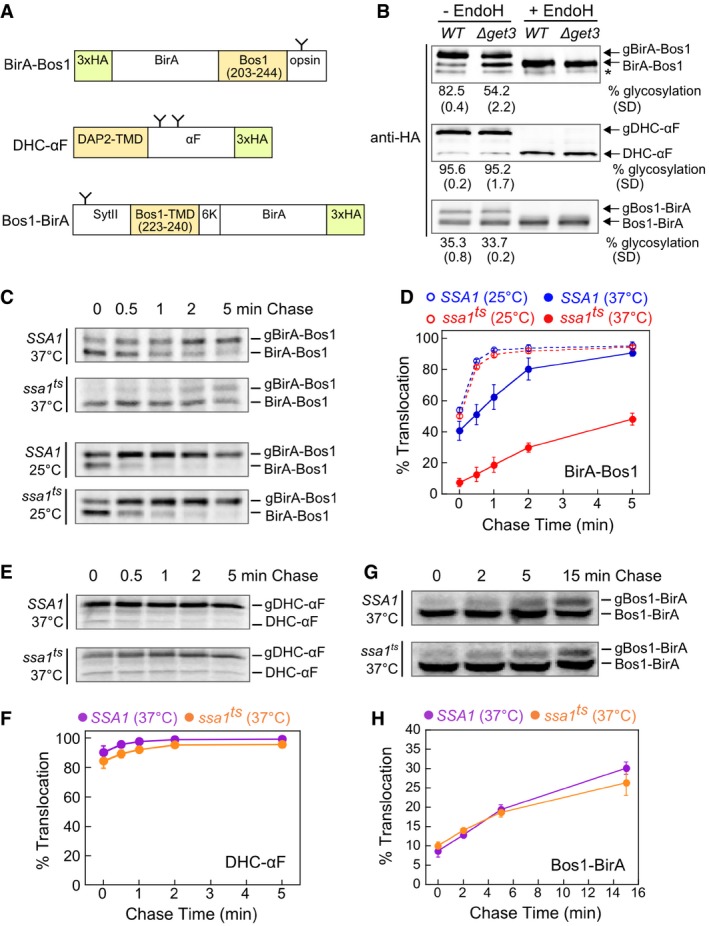
Figure 6. Ssa1 facilitates the post‐translational targeting of TAs to the ER.

-
ASchematic representation of model substrates for the in vivo targeting assay (see details in Materials and Methods). The C‐terminal opsin tag or the native glycosylation sites in ppαF (Ng et al, 1996) and SytII (N32; Kida et al, 2000) allow substrate insertion into the ER in the correct topology to be detected by glycosylation. The glycosylation sites on the model substrates are depicted as “Y”. N‐ or C‐terminal 3xHA tags allow immunoprecipitation or Western blot detection of the substrates. The residues of Bos1 used in the substrates are shown in the diagram. To enforce type I topology of the Bos1‐BirA substrate, additional sequences were introduced at the N‐terminus (mouse synaptotagmin II (SytII) residues 1–18, 20–45, 61–65) and C‐terminus (insertion of six lysines) of the Bos1‐TMD.
-
BSteady‐state translocation levels of BirA‐Bos1, DHC‐αF, and Bos1‐BirA in WT and ∆get3 cells. Glycosylated (g) and non‐glycosylated proteins were resolved by SDS–PAGE, detected by anti‐HA antibody, and corroborated by endoglycosidase H (endoH) treatment. Quantifications of glycosylation efficiency are shown below the blot images. * denotes a non‐specific band detected by anti‐HA antibody.
-
CPulse‐chase analysis of the translocation of metabolically labeled BirA‐Bos1 in SSA1 (blue) and ssa1 ts (red) cells at 25°C (dashed lines and open circles) and 37°C (solid lines and closed circles).
-
DQuantification of the data in (C) and replicates.
-
E–HPulse‐chase analysis of the translocation of metabolically labeled DHC‐αF (E) and Bos1‐BirA (G) in SSA1 (purple) and ssa1 ts (orange) cells at 37°C. Panels (F) and (H) show the quantification of the data in (E) and (G), respectively, and their replicates.
