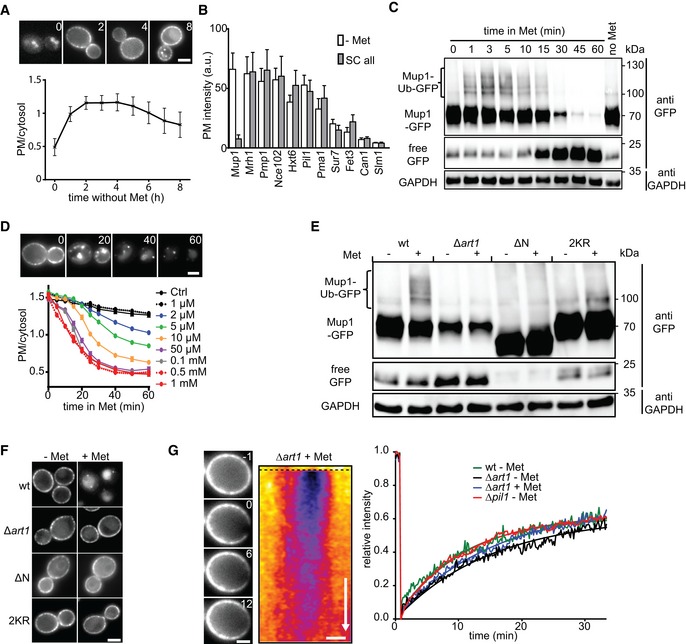
Expression and localization of Mup1‐GFP to the PM upon Met starvation (timestamps in hours). Values are means ± SD, n > 60 cells.
PM expression of various GFP‐fusion proteins in cells grown on complete and Met‐deficient media. Values are means ± SD, n = 20–300 cells.
Western blot showing Mup1 ubiquitination (Ub) and degradation at different time points after addition of Met. Loading control: glyceraldehyde‐3‐phosphate dehydrogenase (GAPDH).
Effect of different Met concentrations on Mup1 internalization kinetics. Values are means ± SEM, n > 50 cells (timestamps in min).
Western blot showing Mup1 ubiquitination (Ub) of the indicated mutants 5 min after Met addition. Loading control as in (C).
Mup1 endocytosis of the mutants used in (E).
FRAP analysis of Mup1‐GFP. Timestamps in min relative to bleaching event. The kymograph was drawn around the cell periphery and shows fluorescence recovery in the bleached area. Recovery curves represent averaged values from n = 3–5 cells. Smooth lines indicate exponential fits. Time arrow: 10 min.
Data information: Scale bars: 2 μm. All values are listed in
.

