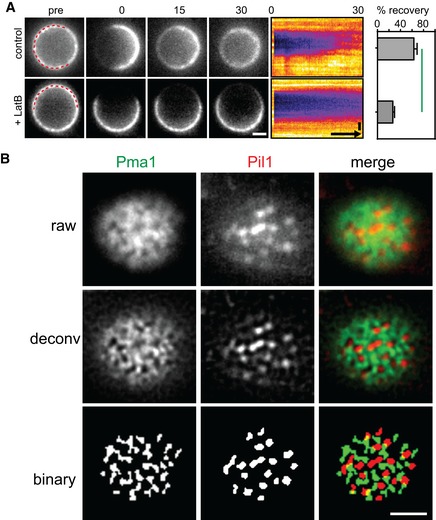
FRAP analysis of Mup1‐GFP in the presence and absence of 100 μM LatB. Times are given in min relative to localized bleaching of fluorescence. The kymograph was drawn around the indicated cell periphery (red dashed lines) and shows fluorescence recovery in the bleached area. Mup1‐GFP fluorescence recovery was determined in the bleached area at
t = 30 min. Time arrow represents 10 min. Values are means ± SD,
n = 10 cells. The green line indicates significantly different data sets. An overview of the performed statistics can be found in
Table EV3.

