-
A
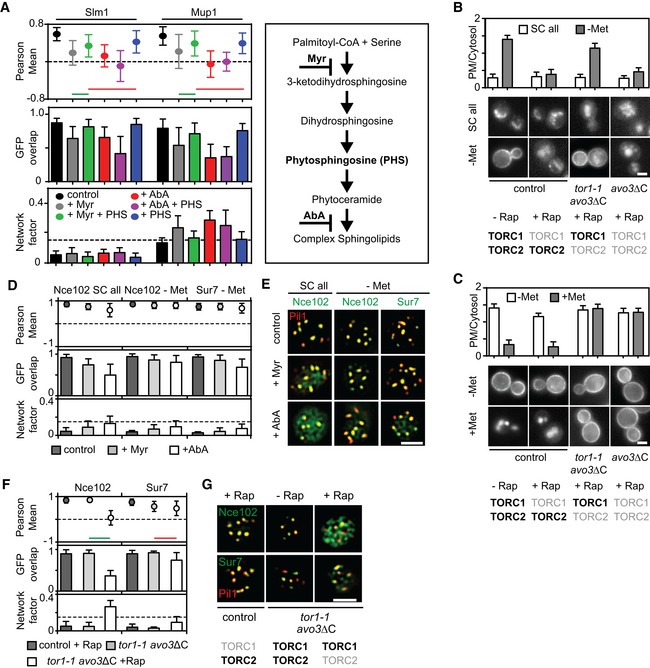
Myriocin—but not aureobasidin A—induced Slm1 and Mup1 MCC exit is reversed upon treatment with phytosphingosine (PHS). Pil1‐RFP was used to determine the degree of concentration within the MCC.
-
B, C
Requirements of TORC1 and TORC2 for the delivery of Mup1‐GFP to the PM upon methionine starvation (B) and for Mup1 endocytosis upon addition of methionine (C). In control cells, only TORC1 is rapamycin (Rap) sensitive, in the avo3ΔC mutant, both TORC1 and TORC2 are sensitive to rapamycin, and in the tor1‐1/avo3ΔC mutant, only TORC2 is rapamycin‐sensitive. Representative equatorial images are shown.
-
D
Influence of sphingolipid stress on the lateral segregation of the tetraspanners Nce102 and Sur7 under Met starvation. Pil1‐RFP was used to determine the degree of concentration within the MCC.
-
E
Representative two‐color TIRFM images from the experiments summarized in (D).
-
F
Nce102 leaves the MCC upon TORC2 inhibition.
-
G
Representative two‐color TIRFM images from the experiments summarized in (F).
Data information: All values plotted are means ± SD,
n = 20–150 cells. In (B, C and G), light gray labels indicate inactive TOR complexes, and bold labels indicate active TOR complexes. Green and red lines indicate significantly different or non‐significant data sets, respectively. An overview of the performed statistics can be found in
Table EV3. Scale bars: 2 μm. All measured values are listed in
Table EV1.

