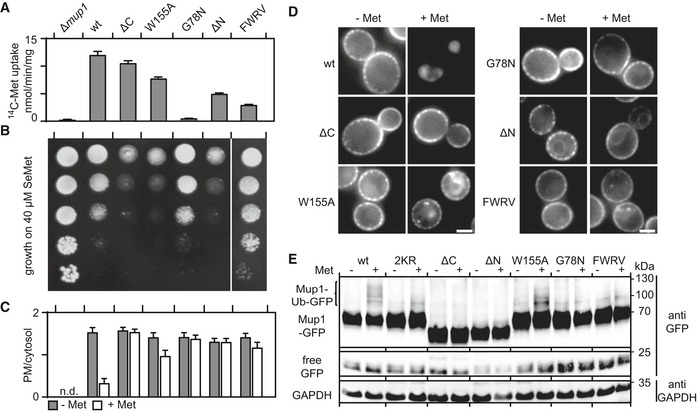
Figure 4. A conformational switch underlies Mup1 function and turnover.

-
A, BComparisons of the functional activities of different Mup1 mutants based on direct quantification of 14C‐Met uptake (A) and growth sensitivity to the toxic Met analog selenomethionine (SeMet, B). Growth assay is shown from top to bottom as a fivefold dilution series. White separator line indicates border to a lane that was removed from the original plate image.
-
C, DEndocytic internalization of the different Mup1 mutants fused to GFP. Ratios of PM to cytosolic fluorescence intensities (C) and representative images at equatorial planes (D) are shown.
-
DWestern blot showing ubiquitination (Ub) of the indicated Mup1 mutants grown in the absence (−) and presence of Met (+, 5 min after addition). Loading control as in Fig 1C. Mutants utilized: wt, wild‐type Mup1; ΔC, deletion of the C‐terminal segment to aa519; W155A and G78N, point mutants; ΔN, deletion of the N‐terminal segment to aa52; FWRV, mutation of aa534–537 to alanines; 2KR, Mup1 with N‐terminal mutations K27R and K28R. All strains refer to Mup1 variants fused to C‐terminal GFP.
