-
A, B
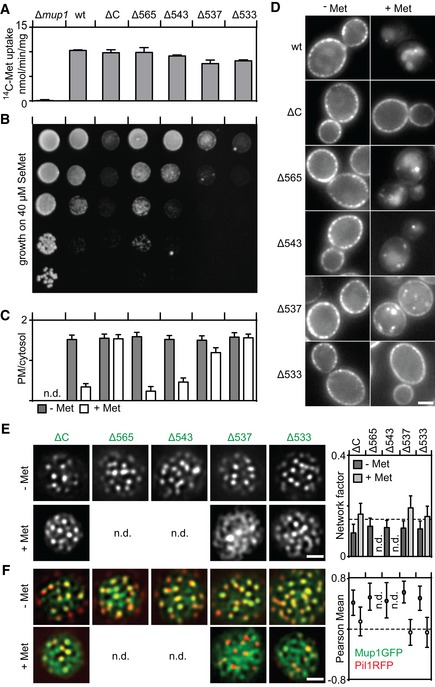
Function of different Mup1 mutants as measured by direct quantification of 14C‐Met uptake (A) and growth sensitivity to the toxic Met analog selenomethionine (SeMet, B). Growth assay is shown from top to bottom as a fivefold dilution series.
-
C, D
Endocytic internalization of different Mup1 mutants. Ratios of PM to cytosolic fluorescence intensities (C) and representative images at equatorial planes (D) are shown.
-
E, F
Lateral PM segregation shown in representative TIRFM images and quantification of the Network factor (E) or the colocalization with Pil1‐RFP (F). Mutants utilized: wt (wild‐type Mup1), ΔC (deletion of C terminus after aa519), W155A and G78N (respective point mutants), Δ565/543/537/533 (deletion of C terminus beyond the indicated position). All strains refer to Mup1 variants fused to C‐terminal GFP.
Data information: Values are means ± SD,
n = 2–4 experiments (A) and
n = 50–200 cells (C, E, F). n.d.: not determined. Scale bars: 2 μm. All values are listed in
Table EV1.

