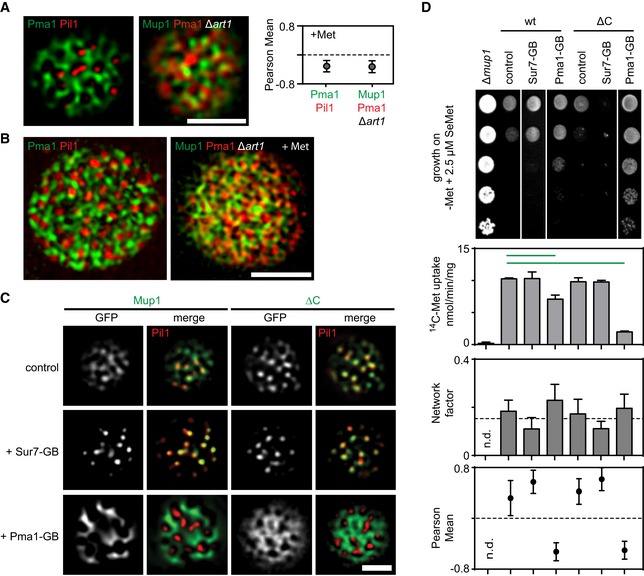
Representative two‐color TIRFM images showing the spatial separation between the MCC (shown as Pil1‐RFP) and the MCP (shown as Pma1‐GFP), and the distribution of Mup1 outside the MCC together with the MCP marker Pma1‐RFP in the absence of ubiquitination and upon Met addition. The graph shows the quantification of colocalization (Person Mean) for the indicated protein combinations.
Representative 3D‐SIM images showing the distribution of the indicated protein pairs in (A).
TIRFM images showing Mup1 and ΔC artificially recruited to different PM domains using the GFP trap system. GB, GFP‐binding nanobody. Pil1‐RFP was used to illustrate the degree of relocation out of the MCC.
Effects of forced relocation on SeMet sensitivity, rate of Met uptake, and the distribution of the respective Mup1‐GFP variant (Mup1/ΔC) in the PM (n.d., not determined). Growth assay is shown from top to bottom as a fivefold dilution series. White separator line indicates border to lanes that were removed from the original plate image. Note that the used concentration of SeMet (no added Met) was not sufficient to induce endocytosis of Mup1.
Data information: Values are means ± SD,
n = 2–4 experiments (uptake),
n = 50–200 cells (Network factor and Pearson Mean). Green lines indicate significantly different data sets. An overview of the performed statistics can be found in
Table EV3. Scale bars: 2 μm. All measured values are listed in
Table EV1.

