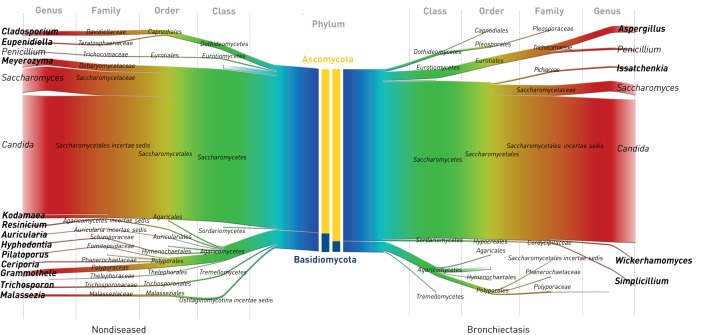
FIGURE 1.
The pulmonary mycobiome in stable bronchiectasis: mirrored Sankey plots illustrating the relative abundance of read classification by taxonomic rank from phylum (centre; blue) to genus level (margins; red). Nondiseased (healthy) controls (n=10) are compared with patients with stable bronchiectasis (n=238). Central coloured bars demonstrate phylum-level abundance of Ascomycota (yellow) versus Basidiomycota (blue) between the cohorts. Cohort-specific fungal genera are indicated in bold.

