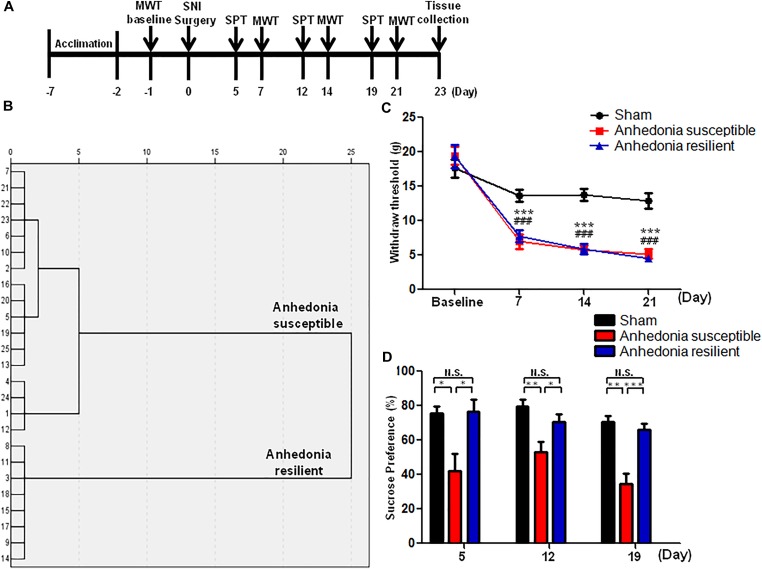
FIGURE 1.
The results of MWT and SPT in sham, anhedonia-susceptible, and anhedonia-resilient rats. (A) The schedule of the experiment. SNI surgery was performed on day 0 after acclimation. MWT was measured on day 7, 14, and 21 after SNI, respectively. SPT was performed on day 5, 12, and 19 after SNI, respectively. (B) Dendrogram of hierarchical clustering analysis. A total of 25 SNI rats were divided into anhedonia-susceptible and anhedonia-resilient groups by SPT results. (C) MWT [Time: F(3,21) = 38.352, P < 0.001; Group: F(2,14) = 66.232, P < 0.001; Interaction: F(6,42) = 9.711, P < 0.001] was measured on day 7, 14, and 21 in the sham, anhedonia-resilient, and anhedonia-susceptible groups after SNI, respectively. Data are shown as mean ± SEM (n = 8). ∗∗∗P < 0.001, susceptible group vs. sham group; ###P < 0.001, resilient group vs. sham group. (D) SPT [Time: F(2,14) = 2.523, P = 0.13; Group: F(2,14) = 30.388, P < 0.001; Interaction: F(4,28) = 0.687, P = 0.609] was measured in the sham, anhedonia-resilient, and anhedonia-susceptible groups on day 5, 12, and 19 after SNI, respectively. Data are shown as mean ± SEM (n = 8). ∗P < 0.05, ∗∗P < 0.01, or ∗∗∗P < 0.001. MWT, mechanical withdrawal test; N.S., not significant; SNI, spared nerve injury; SPT, sucrose preference test.

