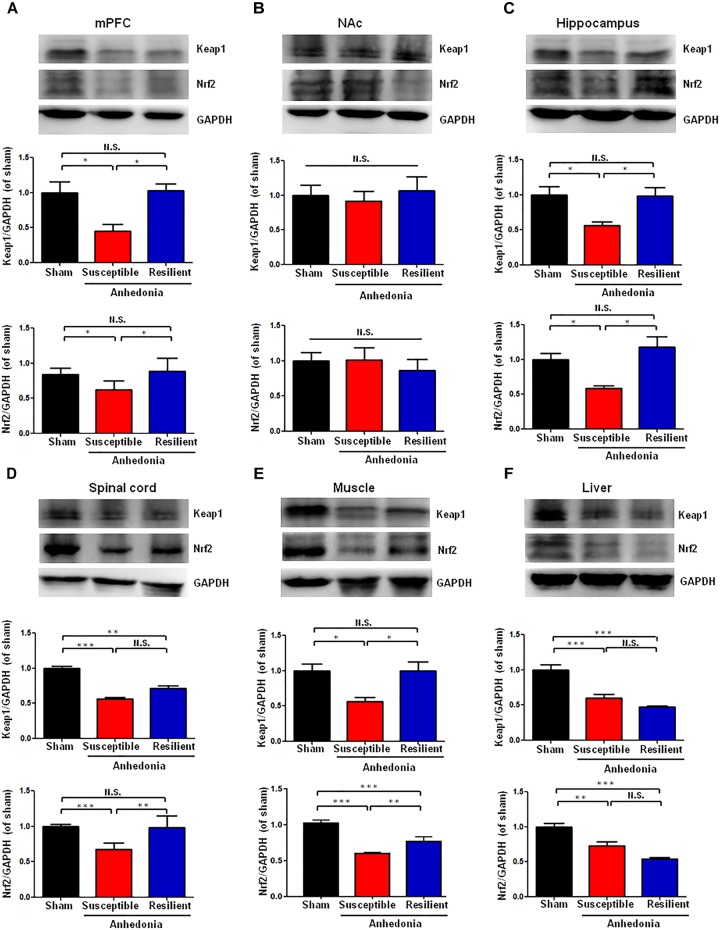
FIGURE 2.
Expression of Keap1 and Nrf2 proteins in selected tissues among the sham, anhedonia-susceptible, and anhedonia-resilient groups. (A) Keap1 [F(2,15) = 9.477, P = 0.02] and Nrf2 [F(2,15) = 11.497, P = 0.013] levels in the mPFC. (B) Keap1 [F(2,15) = 1.811, P = 0.243] and Nrf2 [F(2,15) = 0.289, P = 0.759] levels in the NAc. (C) Keap1 [F(2,15) = 10.833, P = 0.01] and Nrf2 [F(2,15) = 9.248, P = 0.015] levels in the hippocampus. (D) Keap1 [F(2,15) = 62.237, P = 0.011] and Nrf2 [F(2,15) = 31.095, P < 0.001] levels in the L2-5 spinal cord. (E) Keap1 [F(2,15) = 6.35, P = 0.033] and Nrf2 [F(2,15) = 144.8, P < 0.001] levels in the muscle. (F) Keap1 [F(2,15) = 25.886, P = 0.001] and Nrf2 [F(2,15) = 22.201, P = 0.002] levels in the liver. Data are shown as mean ± SEM (n = 6). ∗P < 0.05, ∗∗P < 0.01, or ∗∗∗P < 0.01. Keap1, kelch-like ECH-associated protein 1; mPFC, medial prefrontal cortex; NAc, nucleus accumbens; Nrf2, nuclear factor (erythroid 2-derived)-like 2; N.S., not significant.

