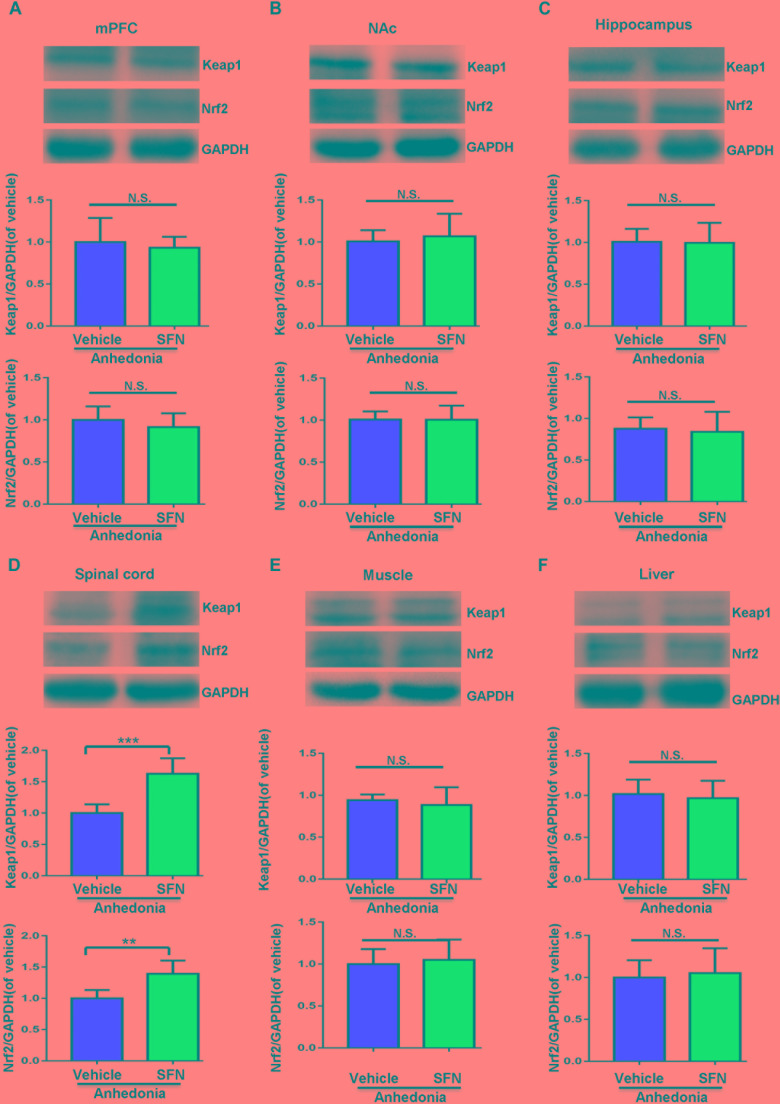
FIGURE 4.
Effects of SFN treatment after SNI surgery on the expression of Keap1 and Nrf2 proteins in selected tissues. (A) Keap1 (t = 0.5248, P = 0.6112) and Nrf2 (t = 0.9042, P = 0.3872) levels in the mPFC. (B) Keap1 (t = 0.4853, P = 0.6379) and Nrf2 (t = 0.01363, P = 0.9894) levels in the NAc. (C) Keap1 (t = 0.1111, P = 0.9137) and Nrf2 (t = 0.3427, P = 0.7389) levels in the hippocampus. (D) Keap1 (t = 5.45, P < 0.001) and Nrf2 (t = 3.861, P = 0.0032) levels in the L2-5 spinal cord. (E) Keap1 (t = 0.6394, P = 0.5369) and Nrf2 (t = 0.4178, P = 0.6850) levels in the muscle. (F) Keap1 (t = 0.463, P = 0.6533) and Nrf2 (t = 0.3559, P = 0.7293) levels in the liver. Data are shown as mean ± SEM (n = 6). ∗∗P < 0.01 or ∗∗∗P < 0.001. Keap1, kelch-like ECH-associated protein 1; mPFC, medial prefrontal cortex; NAc, nucleus accumbens; Nrf2, nuclear factor (erythroid 2-derived)-like 2; N.S., not significant; SFN, sulforaphane.

