
Figure 5. Sparse activation of MC inputs promotes NSC quiescence.
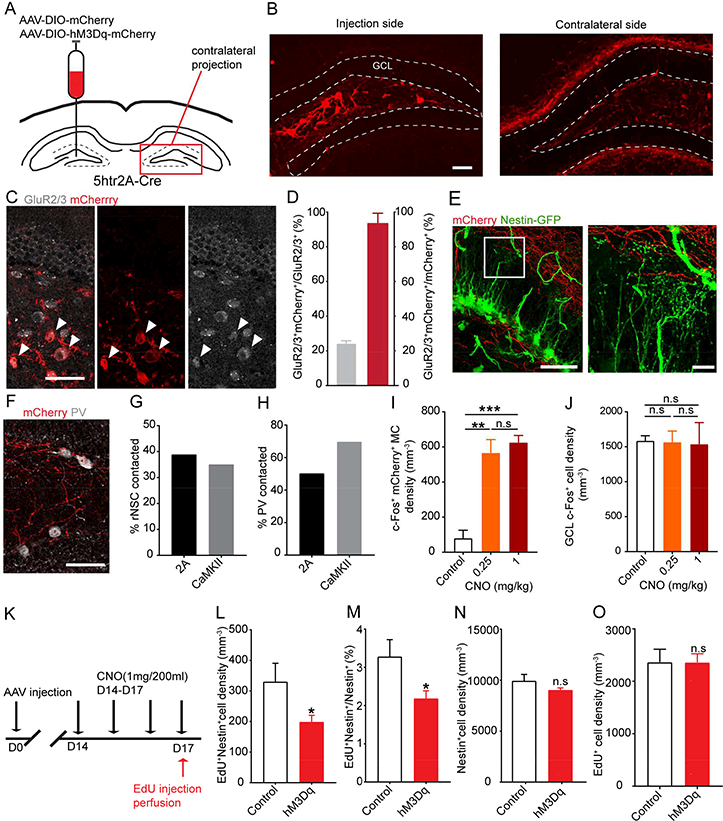
(A) Viral injection scheme in 5htr2A-Cre mice.
(B) Selective labeling of MCs and commissural projections by AAV-DIO-mCherry. Scale bar 50 μm.
(C) mCherry labeled a small subset of GluR2/3+ MCs (white) in the hilus. Arrowheads indicate colocalization. Scale bar 50 μm.
(D) mCherry+GluR2/3+ cells showed specificity for MCs but only labeled a subset of MCs.
(E) 5htr2A-MC commissural projections (red) formed close associations with the bushy processes of rNSCs (green); expanded view of boxed area is shown on right. Scale bars 50, 10 μm.
(F) 5htr2A-MC commissural projections (red) formed close associations with somas of contralateral PV+ interneurons (white) in the SGZ. Scale bar 50 μm.
(G-H) Percentage of contralateral rNSCs (G) or PV+ interneurons (H) contacted by 5htr2A-MC or CaMKII-MC projections.
(I-J) Density of c-Fos+mCherry+ MCs at the injection side (I) or c-Fos+ GCL cells in the contralateral DG (J) upon low- and high-dose CNO. (n=3 mice in each group).
(K) Experimental paradigm for in vivo chemogenetic activation of MCs.
(L-O) Density and percentage of activated rNSCs (L-M), Nestin+ rNSC pool (N), and EdU+ cell density (O) at the MC commissural projection side (n=3 mice in control group, and 5 mice in hM3Dq group).
Values represent mean ± SEM. Significance was determined based on p< 0.05 (n.s: p > 0.05; * p < 0.05; ** p<0.01, *** p< 0.001). See also Figure S4.