
Figure 7. Chronic ablation of MCs leads to a transient increase of rNSC activation followed by rNSC pool depletion.
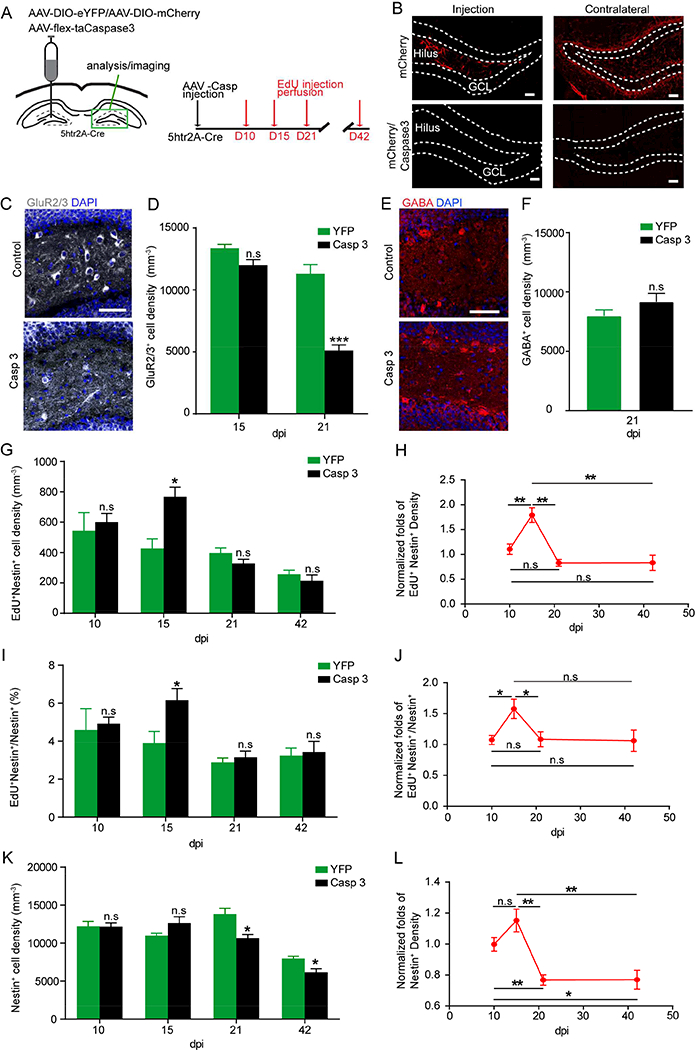
(A) Viral injection scheme and experimental paradigm for chronic ablation of MCs using caspase system in 5htr2A-Cre mice.
(B) AAV-DIO-mCherry labeled MCs and their commissural projections in mCherry only or mCherry and Caspace co-injected animals at 21 dpi. Scale bars 20 μm.
(C) Hilar GluR2/3+ MCs in animals injected with AAV-flex-taCaspase3 versus AAV-DIO-eYFP at 21 dpi. Scale bar 50 μm.
(D) Density of GluR2/3+ MCs remaining in injected hilus at 15 and 21 dpi. (n=3, 4 in control, n=5,4 in caspase, at 15, 21 dpi).
(E) GABA+ interneurons in the hilus injected with AAV-flex-taCaspase3 versus AAV-DIO-eYFP at 21 dpi. Scale bar 50 μm.
(F) Density of GABA+ interneurons remaining in the injected hilus at 21 dpi. (n=4).
(G, I, K) Activated rNSCs (G), percentage of activated rNSCs (I), and rNSC pool (K) at various time points after MC ablation (n=4,3,4,3 in control; n=4,5,4,4 in caspase, at 10, 15, 21, 42 dpi). (H, J, L) Time course of normalized fold change in density and percentage of activated rNSCs (H, J), and rNSC pool (L). (n=4,3,4,3 mice in control group; n=4,5,4,4 mice in caspase group, at 10, 15, 21, 42 dpi).
Values represent mean ± SEM. Significance was determined based on p< 0.05 (n.s: p > 0.05; * p < 0.05; ** p<0.01; *** p<0.001). See also Figure S6.