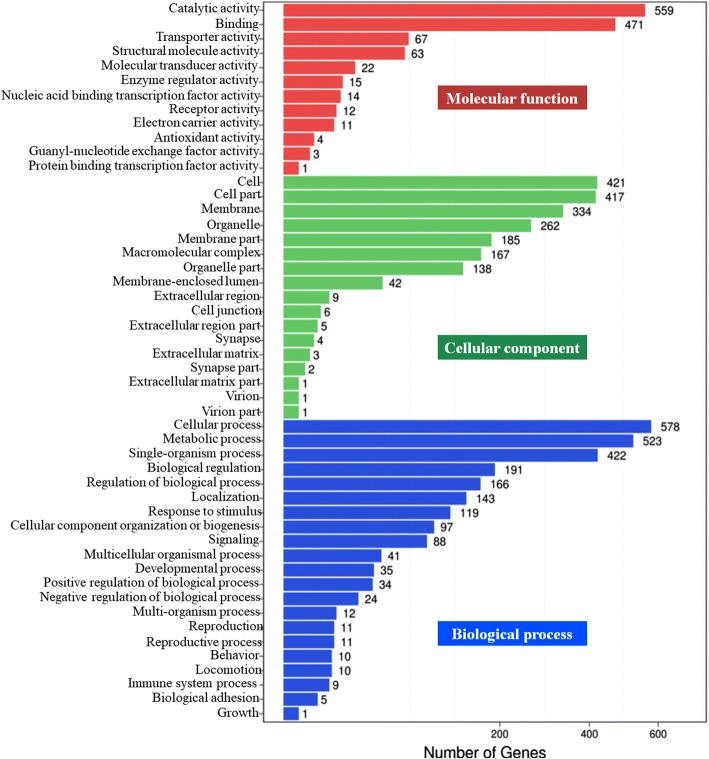
Fig. 4.
GO functional classification of differentially expressed miRNAs target genes from the gill of S. paramamosain in response to a sudden drop in salinity from 23‰ to 3%. The number of DEGs (presented as a square root value) is shown on the X axis, while GO terms are shown on the Y axis. All GO terms are grouped in to three ontologies: biological processes are shown in blue, cellular components in green, and molecular functions in red

