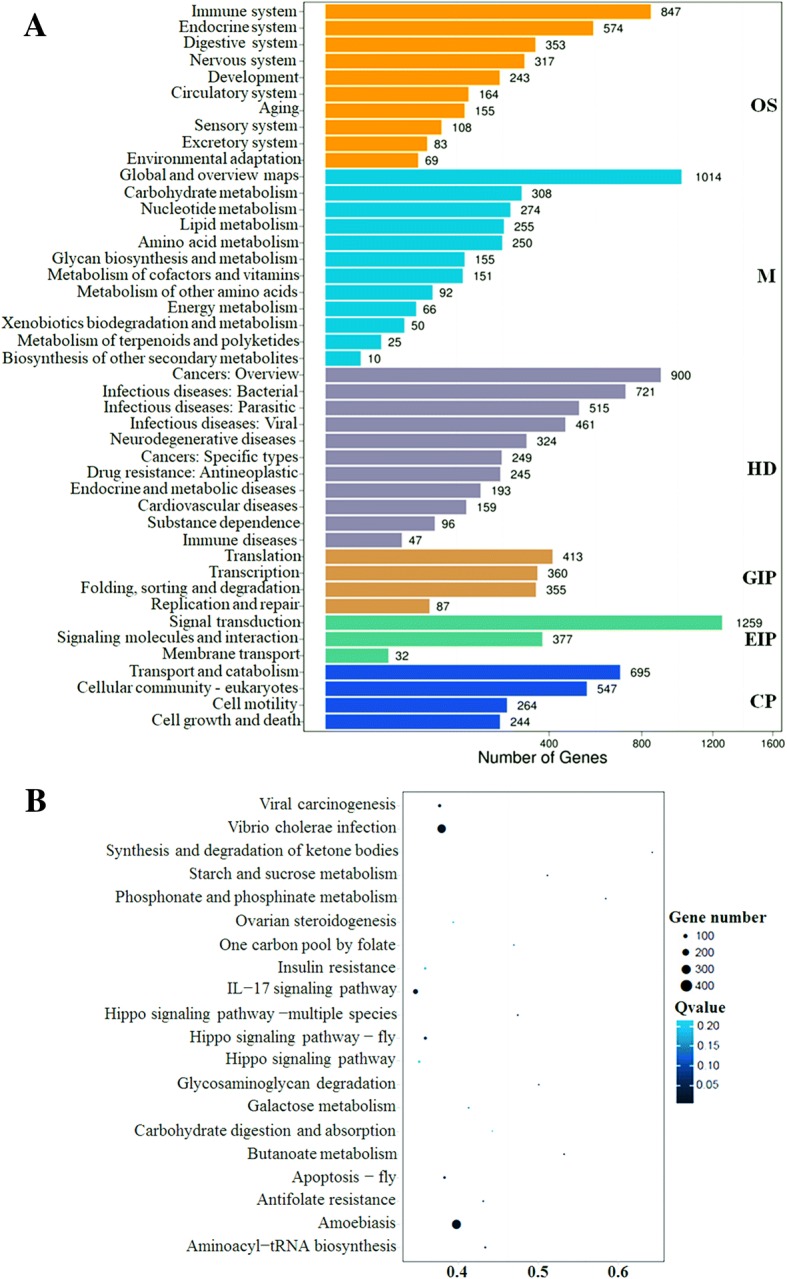
Fig. 5.

KEGG pathway classification (a) and functional enrichment (b) of differentially expressed miRNAs target genes. a The numbers of DEGs are shown on the X axis, while the KEGG pathway terms are shown on the Y axis. All second pathway terms are grouped in the following top pathway terms, as indicated by different colors: OS, organismal systems; M, metabolism; HD, human diseases; GIP, genetic information processing; EIP, environmental information processing; and CP, cellular processing. b RichFactor is the ratio of DESs of target genes annotated in this pathway term to all gene numbers annotated in this pathway term. Greater richFator means greater intensiveness. The Q-value is the corrected p-value ranging from 0~ 1. A lower Q-value indicates greater intensiveness. The top 20 enriched pathway terms are displayed (Q-value < 0.05)
