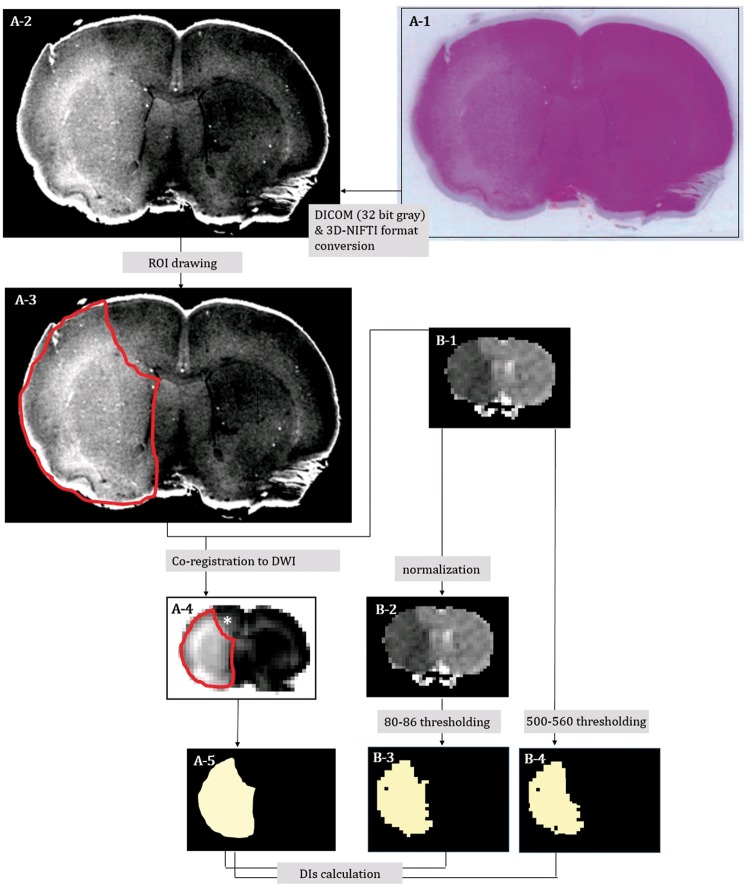
Figure 2.
Digitalization of the hematoxylin-eosin (H&E) pathologic slide and co-registration onto matching coronal ADC map images in representative animal 5; H&E pallor in the gross pathology slide (A-1) was more evident in the digitalized image (converted to 3D-NIFTI format via 32-bit gray DICOM) (A-2). H&E pallor ROI on the digital pathology was manually defined as the red-line area (A-3). Coronal ADC map image (B-1: ADCoriginal) was selected as a reference, and the ROI on the digital H&E pathology was co-registered onto the ADC map image (A-4) and binarized (A-5). The hyper-intense area (* in A-4) appeared only after co-registration. ADCoriginal (B-1) was normalized (B-2: ADCnormalized). Then, we segmented the focal ischemic lesion ROIs of coronal DWI (in seven of the eight rats) with gradually differing thresholds (80–86 relative thresholds (THRrelative) of ADCnormalized and 500–560 absolute thresholds (THRabsolute) of ADCoriginal) and binarized them (B-3 and B-4).

