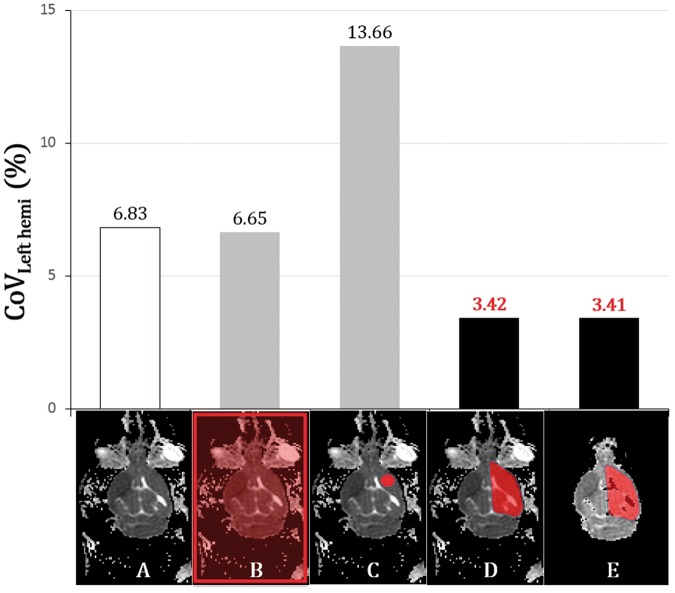
Figure 3.
Four types of ROIs on a representative ADC map (animal 1) and comparison of the mean of CoVLeft hemi in the 120 scans. An original axial ADC image at 15 min (A) showed background noise and CSF. Four different ROIs (B–E) were superimposed: (B)whole-field ROI; (C) largest circular ROI in the left hemisphere by manual drawing, CSF and parenchymal boundary excluded; (D) ROI including the whole left hemisphere with background noise and CSF; and (E) ROI including the whole left hemisphere without background noise and CSF. The bar graph shows that normalization with the whole left hemispheric ROI yielded the best result regardless of the removal of background noise and CSF.

