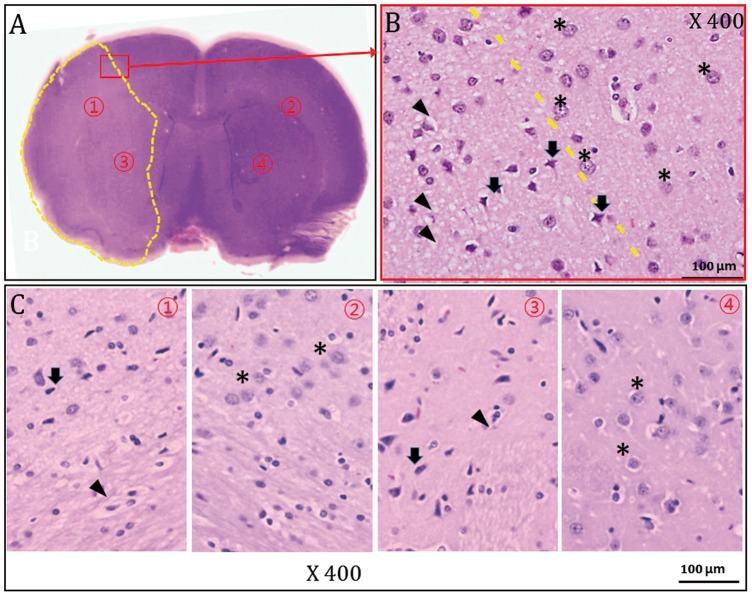
Figure 6.
Gross and high-magnification light-microscopic findings of H&E pathology 1 h after MCAO (representative animal 5). The H&E-stained slide clearly demonstrated a pallor area corresponding to the right MCA territorial ischemic lesion (A). (B) The high-magnification (×400) image of the area outlined in red in (A) shows different cellular morphology of both the damaged (arrows) and normal regions (asterisks). (C)High-magnification images (×400) of ischemic regions (① and ③ in (A)) and contralateral non-ischemic areas (② and ④ in (A)). Note the many pyknotic nuclei (arrows) and vacuolated cytoplasms (arrows) in the H&E pallor area ((B) and (C) ①, ③).

