
Fig. 1.
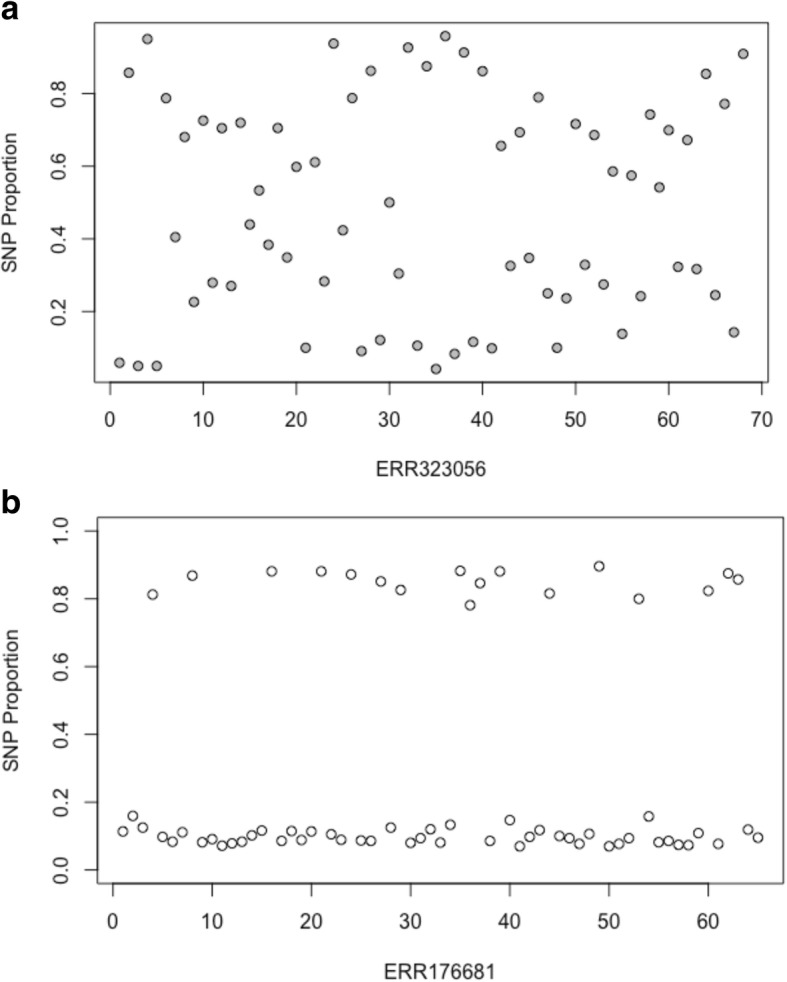
Heterozygous SNP plots for two clinical Malawi samples, illustrating the difference between clonal heterogeneity (a) and the signals of mixed infections (b). The x-axis represents contiguous SNPs across the genome (numbered sequentially) with heterozygous SNP calls, and the y-axis represents the proportion of non-reference alleles at that SNP. a shows no evidence of mixed infection, with read frequencies at heterozygous sites randomly distributed between 0 and 1. b demonstrates the characteristic pattern of mixed infection with two different strains, with the read frequencies clustering into two distinct clusters with means around 0.90 and 0.10, implying a 0.9/0.1 mixture