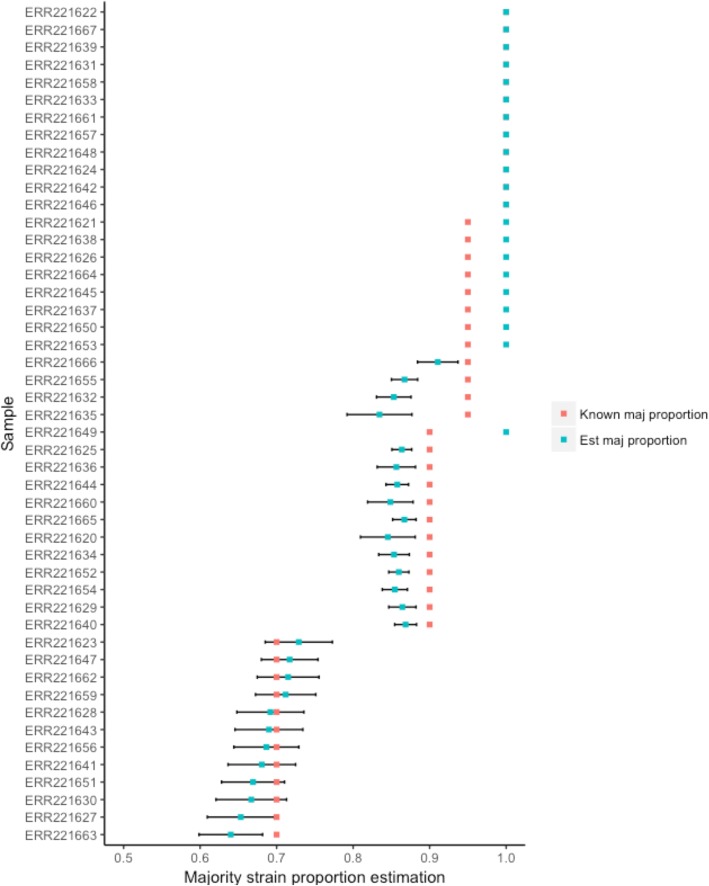
Fig. 3.
A comparison of the major strain proportion estimated through Bayesian model- based clustering (blue) against the known majority strain proportion (red) in all in vitro artificial mixture samples (N = 48). The standard deviation of allele frequencies of heterozygous sites around the mean of the estimated major proportion is shown by the error bars in black

