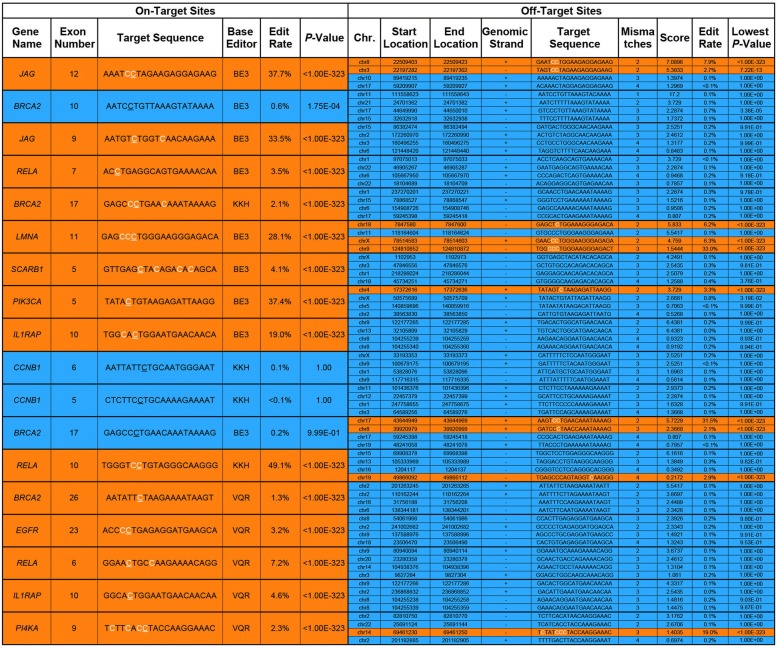
Table 1.
Summary of off-target modification analysis by next-generation sequencing
Left column displays on-target sites each with four corresponding off-target sites in the right column. Sites displaying statistically significant C>T or G>A conversion are colored orange, while sites not displaying such conversion are colored blue. The specific locations in the target sequences where statistically significant conversion was observed are colored white. For the on-target site target sequences, the base that corresponds to the flanking intronic G is underlined. The “Edit rate” and “P-value” columns in the on-target section refer to the flanking intronic G. The “Edit rate” and “Lowest P-value” columns in the off-target section refer to the location within the off-target sequence with the most statistically significant C>T or G>A conversion

