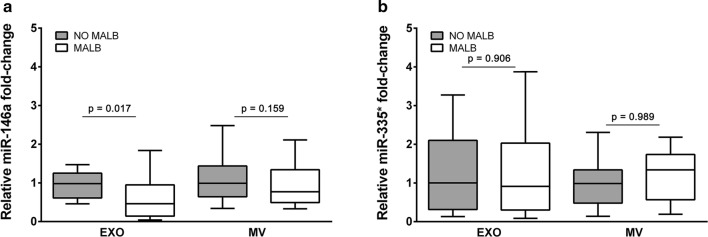
Fig. 3.
Box plots of the miR-146a and miR-335* levels in exosomes and microvesicles according to the presence of a albuminuria for miR-146a and b for miR-335*. Relative expression shown was calculated using the 2−(ΔΔCt) method. The median Ct value of the spike-in cel-miR-39a in all samples was used as a control. The data were compared using the Mann–Whitney U test. EXO exosomes, MV microvesicles

