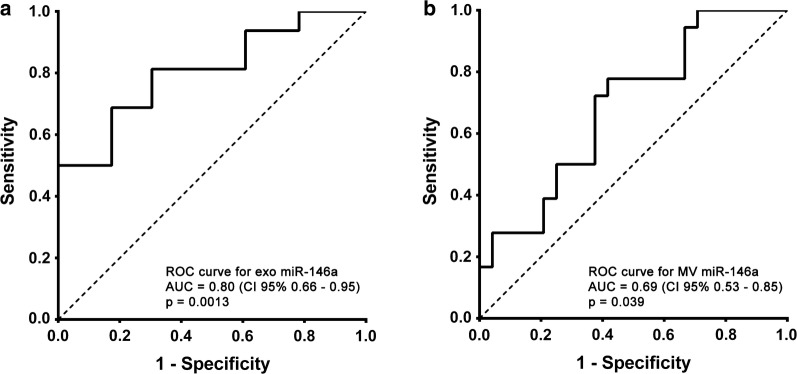
Fig. 5.
ROC analysis of urinary microRNA expression in extracellular vesicles from normalbuminuric and microalbuminuric hypertensive patients. Receiver operator characteristic (ROC) curves were constructed using the microRNA expression values for miR-146a in exosomes (a) and microvesicles (b). The area under the curve (AUC) and 95% CI were computed and are shown for each ROC curve. The Wilcoxon and Mann–Whitney U tests were used to test the null hypothesis that the AUC is equal to 0.5, and the probability values for each test are shown

