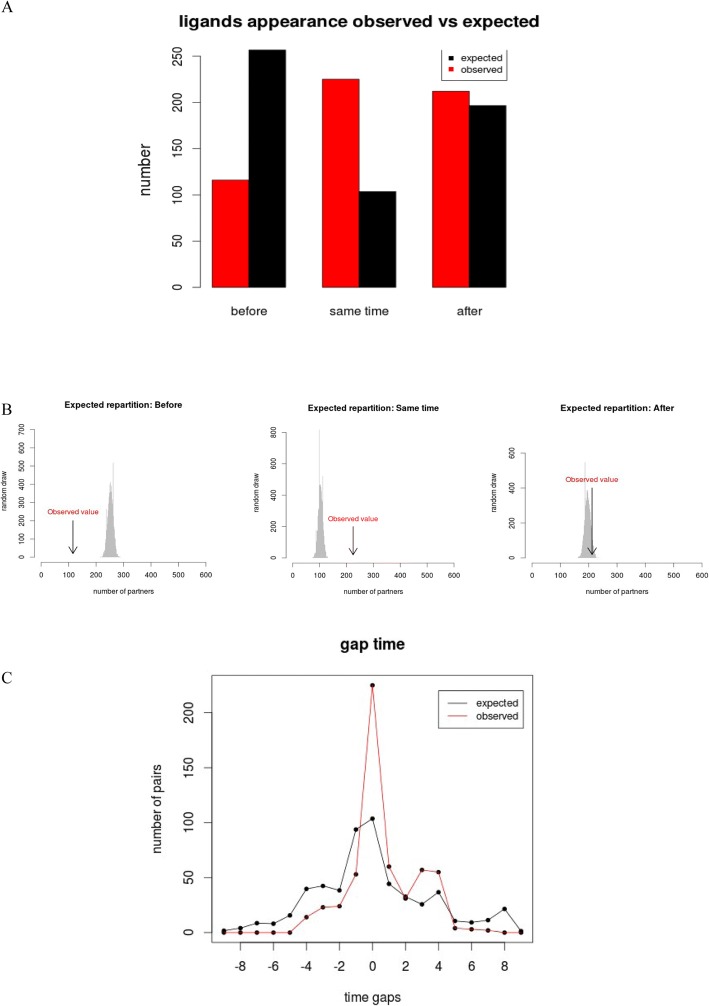
Fig. 3.
a Barplot of the global distribution of the 553 partners in each of the three categories. Category 1: Ligands which appeared before their receptors; Category 2: ligands which appeared in the same branch as their receptors; Category 3: ligands which appeared after their receptors. The x-axis represents the three categories, the y-axis represents the number of partners. The red bars correspond to the observed distribution. The black bars correspond to the expected distribution. 116 pairs were observed for which the first ligand of the considered receptor appeared before, against 256 expected. 225 pairs were observed for which the first ligand of the considered receptor appeared in the same branch, against 102 expected. 212 pairs were observed for which the first ligand of the considered receptor appeared after, against 195 expected. b Distribution of the 553 randomly selected partners, repeated 10,000 times (grey). The position of the observed number of partners is indicated with an arrow. c Distribution of the distance (in terms of branches of appearance) between all the genes encoding the ligands and their receptors. The red curve represents the observed data, and the black curve the expected distribution found with the random draws. 0 corresponds to a pair of ligand/receptor that appeared in the same branch. We observe an expected peak at 0 in the black curve due to the fact that a gap of 0 can be obtained over 10 branches, whereas a gap of 1 can only be obtained over 9 branches, a gap of 2 over 8 branches, etc. The negative values represent the genes encoding the ligand that appeared n branches before the gene encoding the receptor. The positive values correspond to the gene encoding receptors that appeared n branches before the gene encoding the ligands

