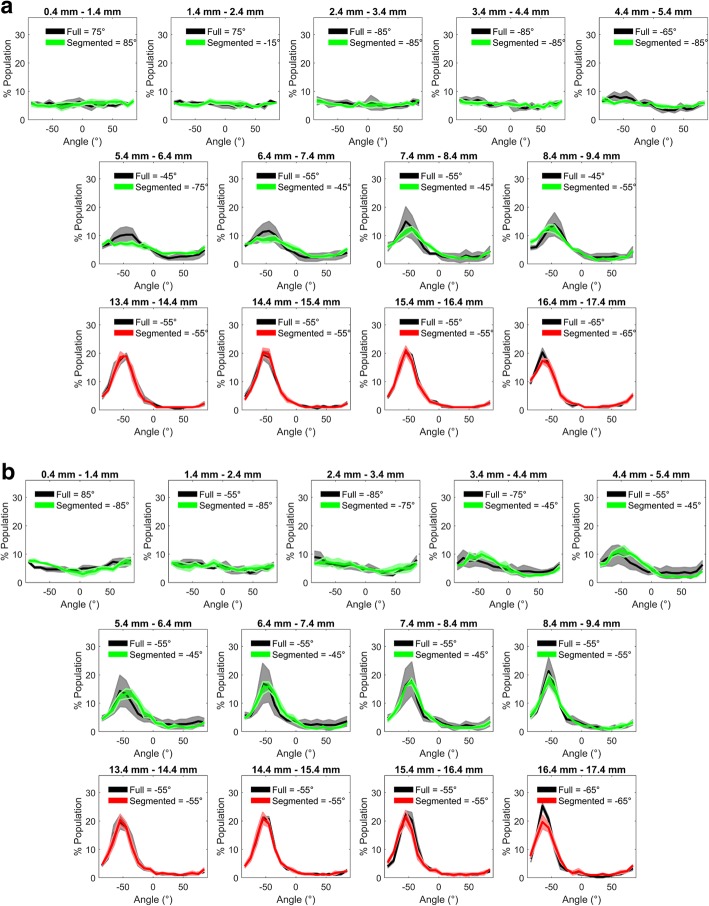
Fig. 5.
Orientation of HUVEC nuclei in wells where the cells were growing only in the central region (green), only near the edge (red) or everywhere (grey). Each panel shows a different radial distance from the centre of the well. Mean data are presented as lines of best fit (obtained using seventh-order polynomials) and shaded areas show the standard error of the mean for 3 independent experiments. a shows results for untreated HUVEC and (b) shows results for TNF-α treated HUVEC. The modal orientation, with and without segmentation, is shown at the top of each panel. panel. Note the absence of alignment near the well centre

