Fig. 1.

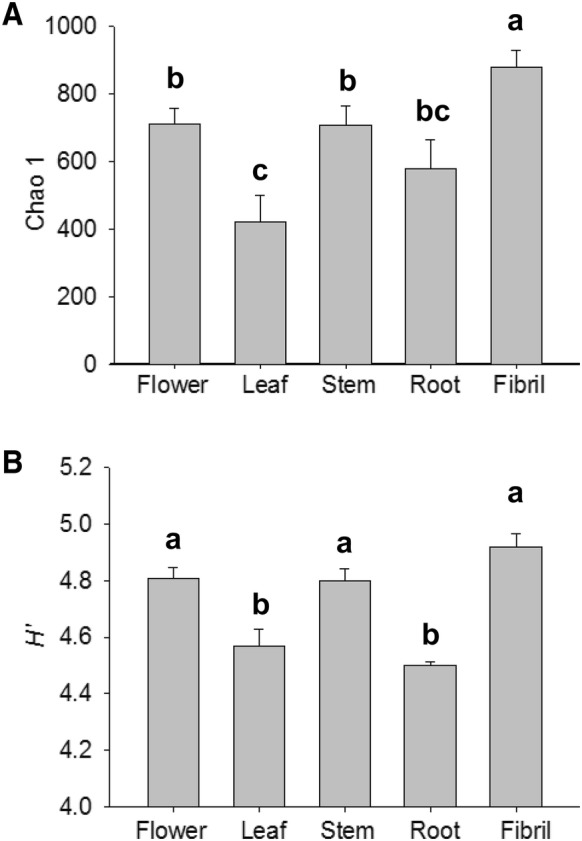
Changes of Chao 1 (A) and Shannon indices (B) for the 16S rRNA gene sequences from samples of P. notoginseng parts. The value of each bar represents the mean ± SD of n = 3. Different letters indicated significant difference at the 0.05 level

Changes of Chao 1 (A) and Shannon indices (B) for the 16S rRNA gene sequences from samples of P. notoginseng parts. The value of each bar represents the mean ± SD of n = 3. Different letters indicated significant difference at the 0.05 level