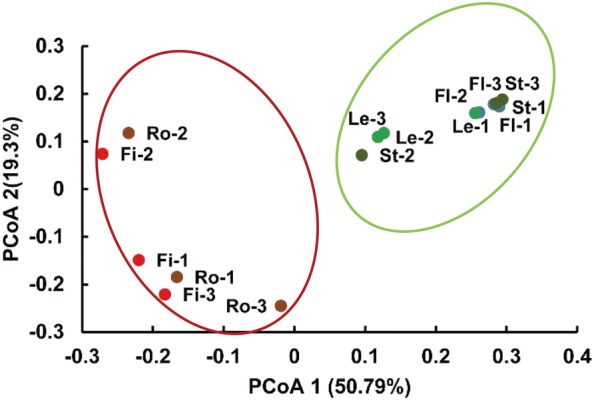
Fig. 2.

PCoA ordination plots of bacterial endophytes based on the Bray–Curtis distances of the classified 16S rRNA gene sequences. Fl, Le, St, Ro, and Fi denote the flower, leaf, stem, root, and fibril samples, respectively. -1, -2, and -3 indicate the first, second, and third replicates of each P. notoginseng part, respectively
