Fig. 6.

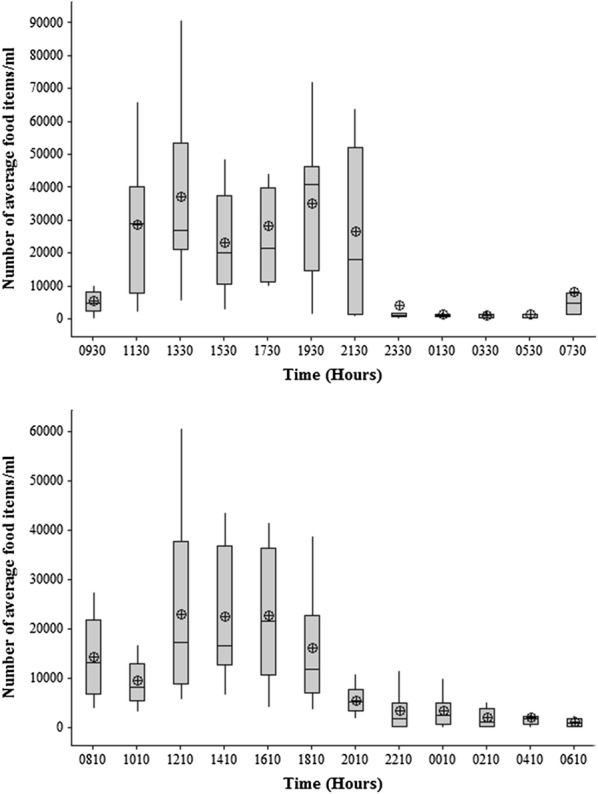
Fluctuations in number of mean food items with time in the gut contents of P. reticulata in a man-made canal and b stream. The box plot whiskers depict the range and circled crosses depict the mean number of food items

Fluctuations in number of mean food items with time in the gut contents of P. reticulata in a man-made canal and b stream. The box plot whiskers depict the range and circled crosses depict the mean number of food items