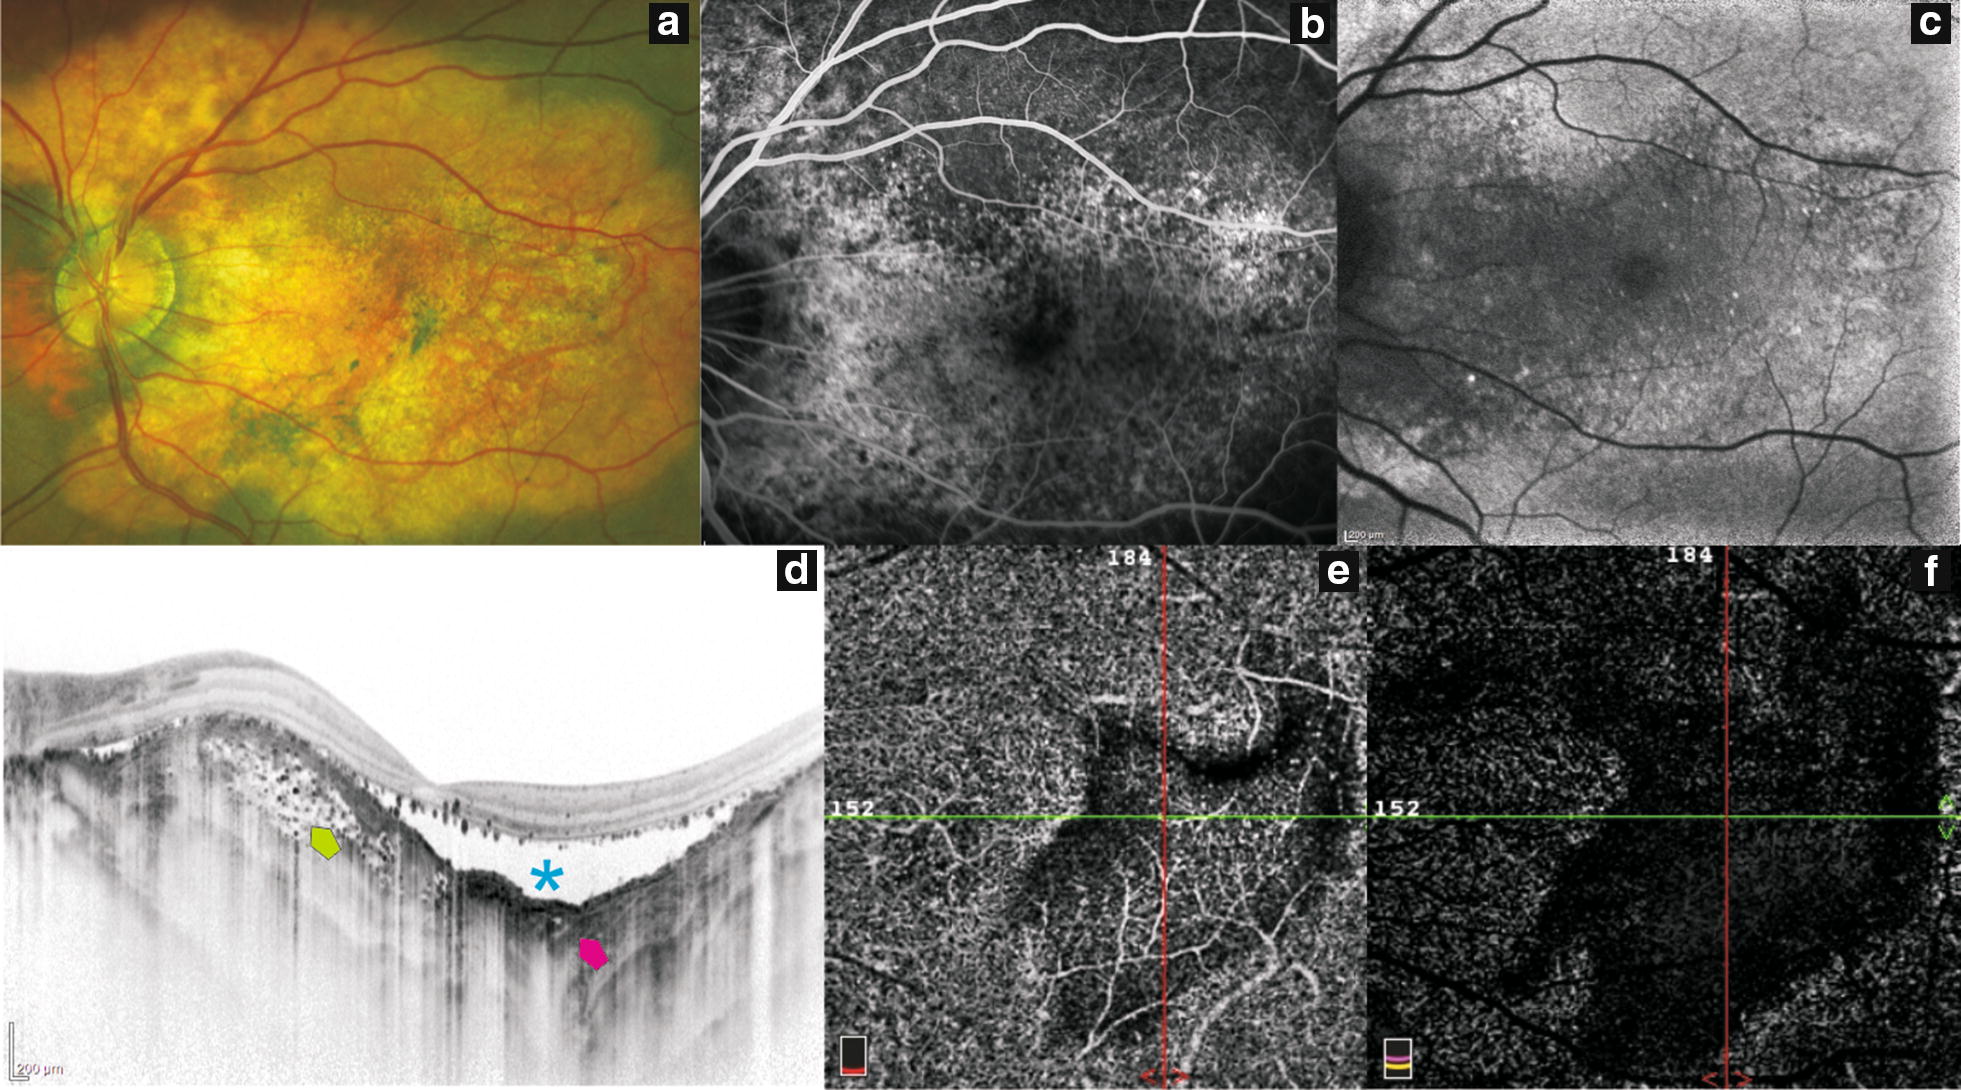
Fig. 2.

Multimodal imaging in choroidal osteoma. a Fundus photograph showing an orange-yellow plaque in the macular region. b Fluorescein angiography showing hyperfluorescence due to damage of the retinal pigment epithelium over a partially ossified tumor (yellow plaque). c Blue-light autofluorescence (bAF) showing predominantly hypo-AF with hyper-AF dots within the tumor. d OCT EDI showing a concave formation within decalcified portion of tumor (asterisk); calcified tumoral regions have multiple hyperreflective dots surrounding hyporeflective spaces (green arrow). e, f. OCT-A. Superficial and deep vascular network showing dark background were the decalcification is present
