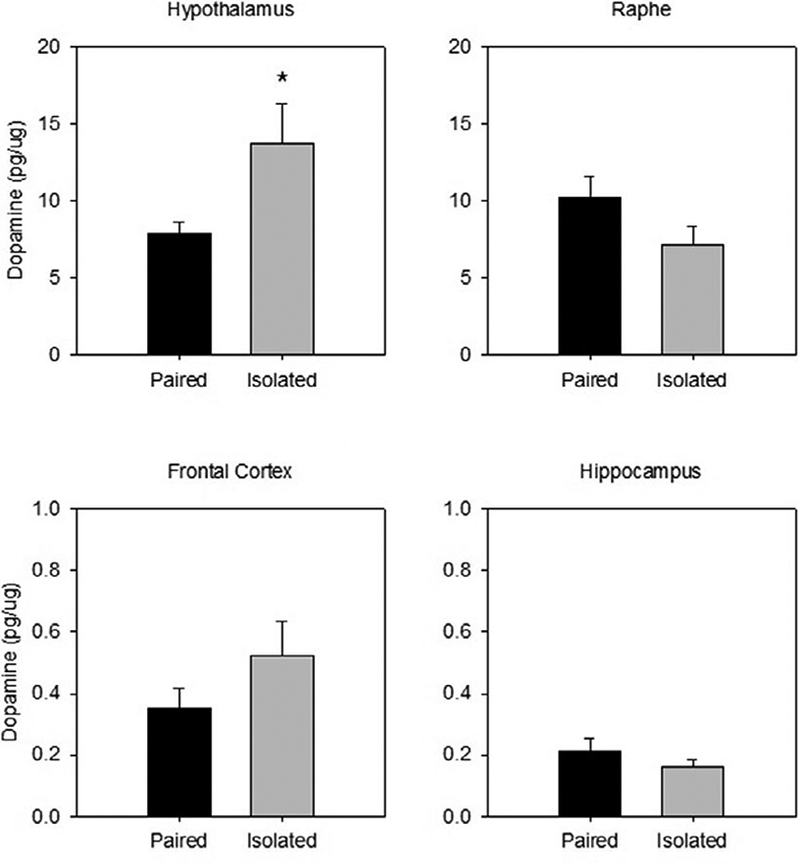
Figure 2.

Mean (± SEM) dopamine concentration observed in the hypothalamus (top left), raphe (top right), frontal cortex (bottom left), and hippocampus (bottom right) following 60 minutes of restraint in prairie voles exposed to prior social isolation or pairing. Social isolation was associated with altered dopamine levels in the hypothalamus but not in the other brain regions. * indicates p<.05 vs. paired group. Note the scale differences among the 4 panels.
