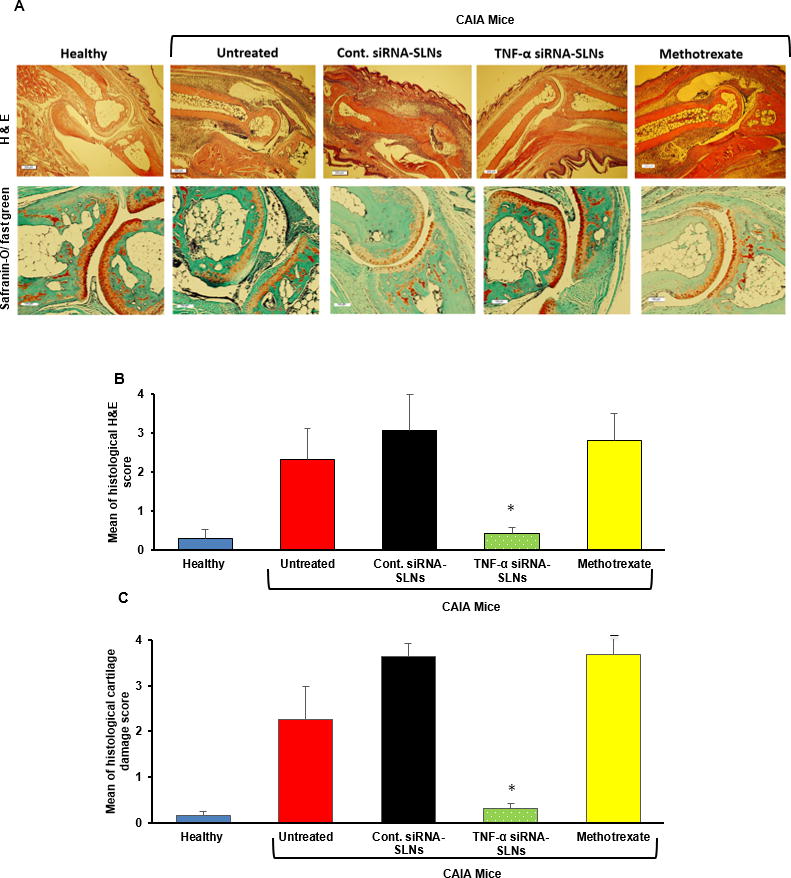
Figure 6. Histological evaluation of AS-TNF-α siRNA-SLNs in a mouse model of CAIA.

(A) Represent H&E (A) and Safranin-O/fast green images of arthritic joints. (B–C) The average scores of the severity of pathological factors such as synovial hypertrophy, density of resident cells and inflammatory cell infiltrates, matrix degradation and osteolysis after H&E staining (B) or safranin-O/fast green staining (C). In B–C, * p ≤ 0.05, AS-TNF-α siRNA-SLNs v s. other CAIA groups. Data are mean ± S.E.M. (n = 3–5). Note: AS-TNF-α siRNA-SLNs and AS-Cont siRNA-SLNs are indicated as TNF-α siRNA-SLNs and Cont siRNA-SLNs in the figures.
