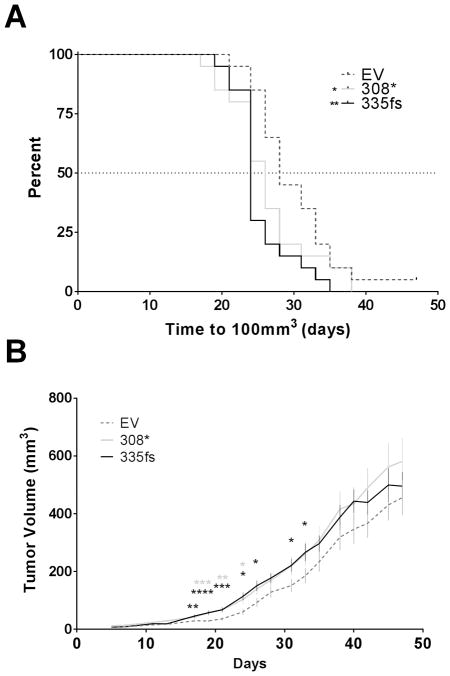
Figure 3.
In vivo growth of ZR751 cells expressing ectopic mutant GATA3. A. Kaplan-Meier curve showing the time to 100 mm3 xenograft tumor volume (*p<0.05, **p<0.01, Log-rank test). B. Comparison of growth rates of ZR751 xenograft tumors. Graph shows tumor volumes and standard error of the mean (n=20 per group, (*p<0.05, **p<0.01, ***p<0.001 and ****p<0.0001, Student’s t-test). EV, ZR751 cells transfected with empty vector control; 308*, ZR751 cells expressing FLAG-tagged GATA3308*; 335fs, ZR751 cells expressing FLAG-tagged GATA3335fs

