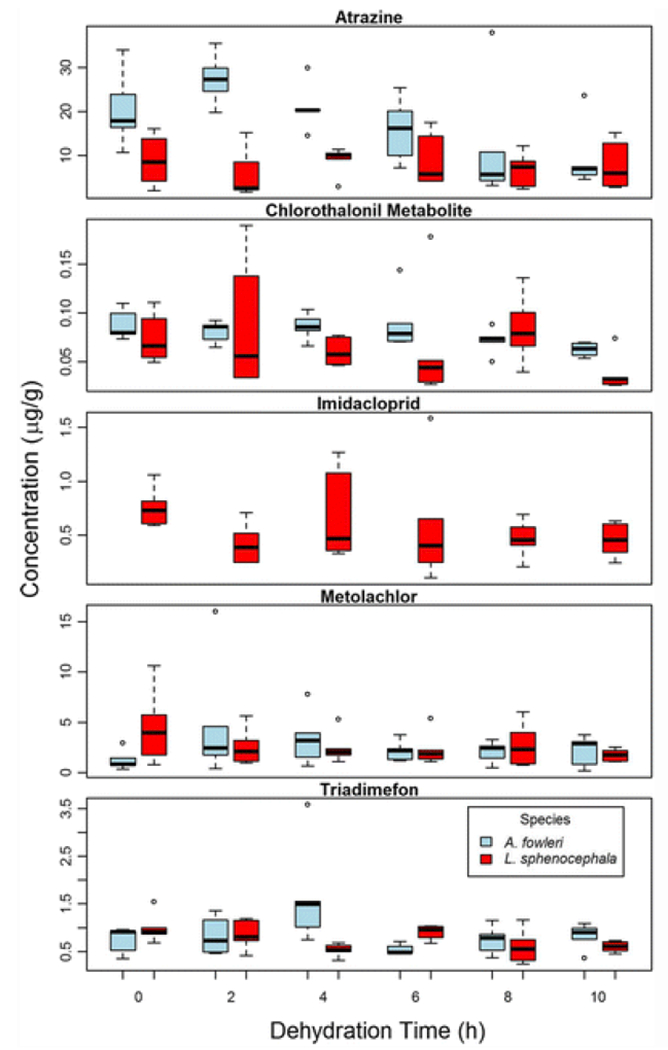
Fig. 1.

Tissue concentrations (μg/g) of exposed amphibians. Atrazine, metolachlor, and triadimefon are the summation of the parent and its corresponding metabolites. The two species are shown next to each other with body burdens presented as boxplot summaries for each of the dehydration time points within the pesticide treatment. Fowler’s toads (Anaxyrus fowleri) (blue) and leopard frogs (Lithobates sphenocephala) (red)
