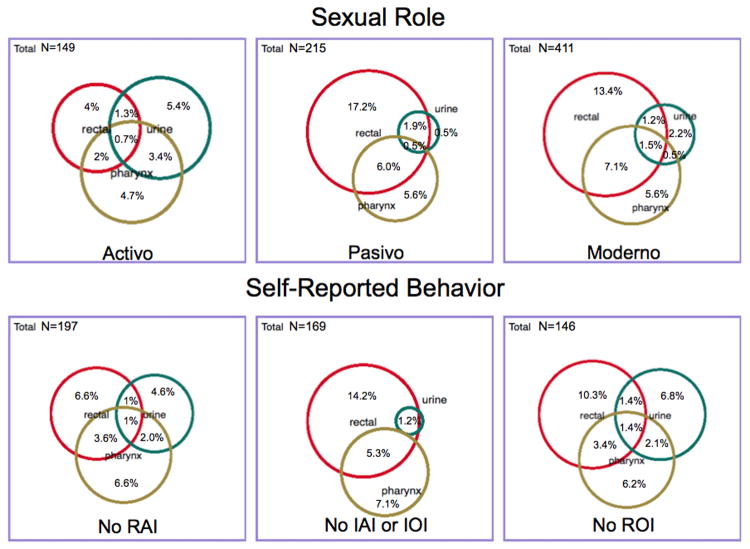
Figure 2. Prevalence of urethral, pharyngeal, and rectal infections by sexual role, and self-reported sexual behavior.
LEGEND (for Figures 1 and 2): The square figure for each Venn diagram represents the sub-population presented therein (denominator for the percentages presented). The relative size of the circles in relation to each other represents the proportion of that population that tested positive for infection at the specified site (numerator for the percentages presented). The percentages presented in the figures are discreet and define only the site(s) of infection they represent. For example, for the “Either Bacteria” sub-population in Figure 1, the “Rectal” percentage equals 12.7%, indicating that 12.7% of participants had infection at the rectal site only, not including those participants with infection of the rectum and another anatomic site. IAI, insertive anal intercourse; IOI, insertive oral intercourse; RAI, receptive anal intercourse; ROI, receptive oral intercourse.

