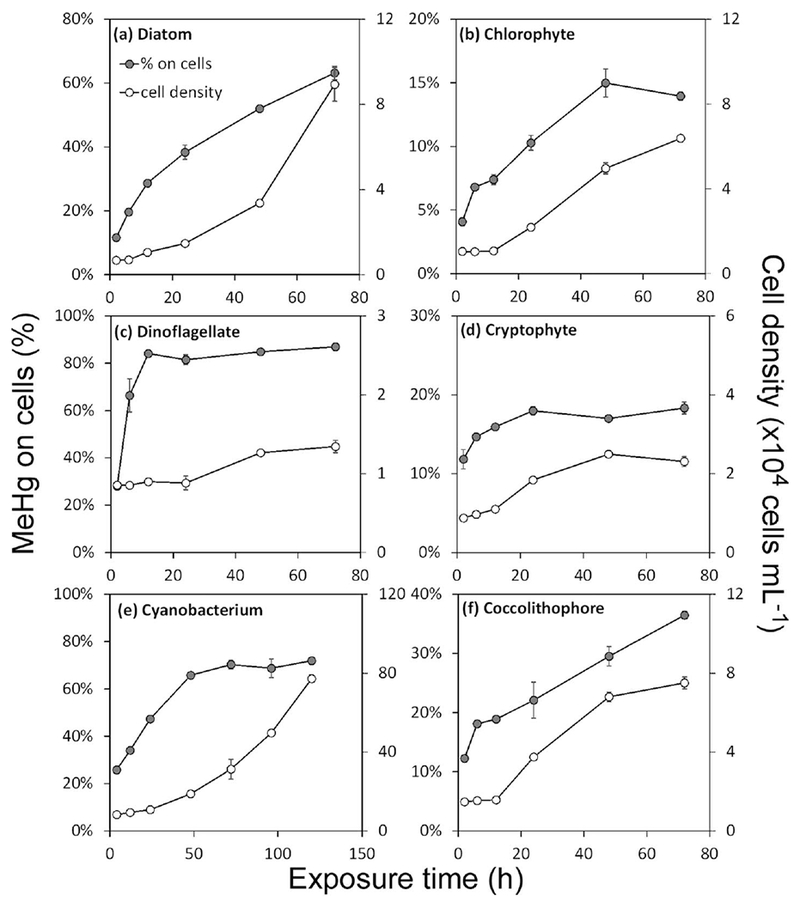
Fig. 1.

MeHg uptake and growth of algal cells among six phytoplankton species over time. The solid circles (left axis) represent the percentage (%) of total MeHg in the cultures associated with the particulate (>1 μm) phase. The open circles (right axis) represent the cell densities (×104 cells mL−1). Data points are the means from three replicates cultures with error bars of one standard deviation. Note the different scales on each graph.
