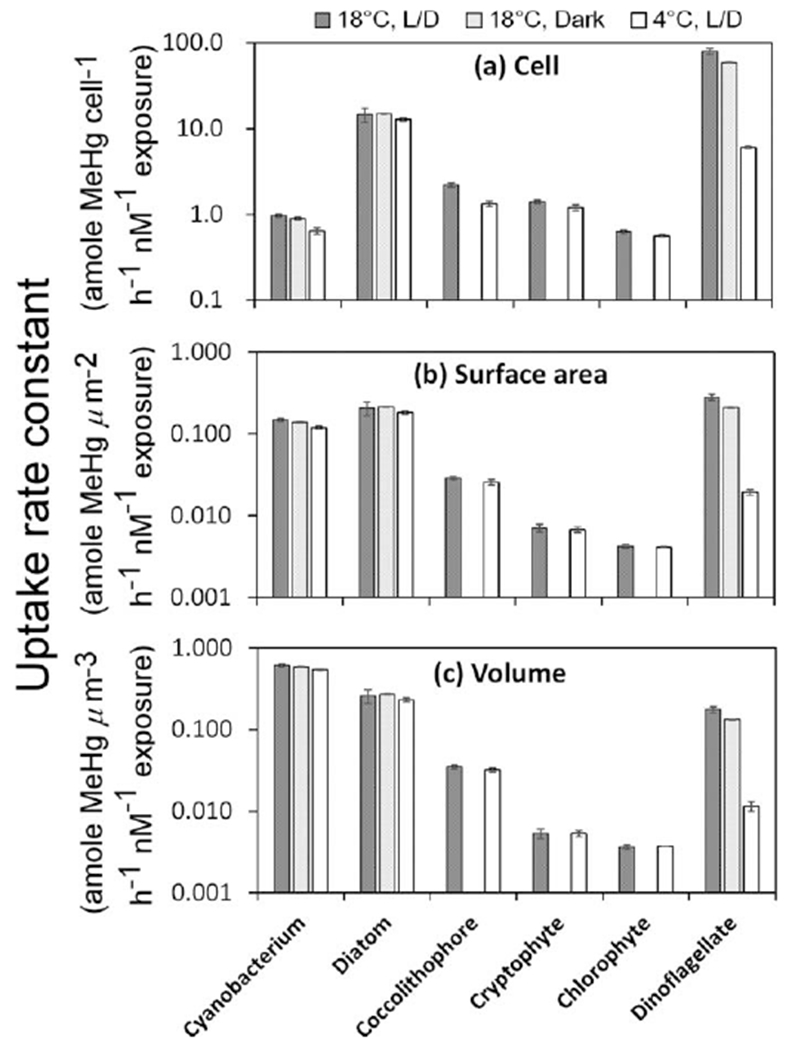
Fig. 5.

Uptake rate constants of MeHg in six different algal species over short-term exposures. Values are normalized to the initial dissolved MeHg concentrations in the media and are expressed on per cell, per μm2 cell surface area, and per μm3 cell volume bases for the first 4 h of exposure. Algal species on the x axis are arranged in increasing size order, with the cyanobacterium being the smallest cell and the dinoflagellate the largest cell.
