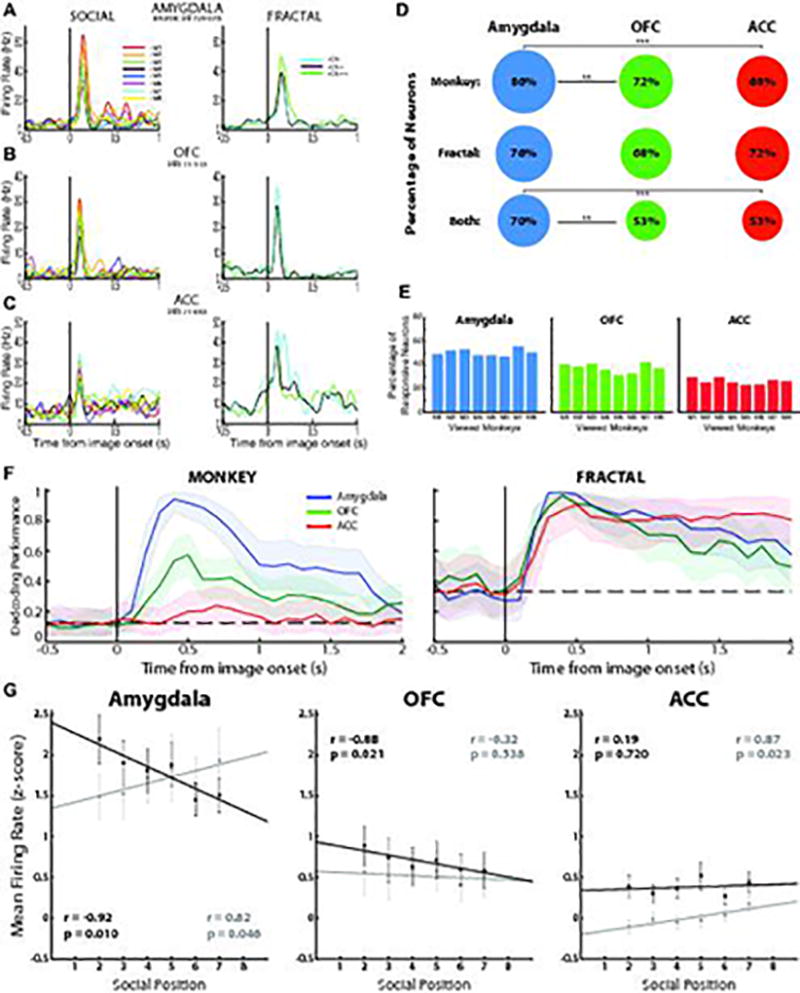
Figure 2. The amygdala represents the hierarchical status of individuals.

A–C. Example neurons from the amygdala (A), OFC (B), and ACC (C) that respond to both face (left panels) and fractal images (right panels). The amygdala neuron responds most strongly to the dominant monkey face image and to the most highly rewarded fractal image, with responses decreasing monotonically with decreases in the hierarchical status of face images or the reward associated with fractals. D. The percentage of neurons in the 3 brain structures that respond to at least one monkey, one fractal or one of both type of images. ** and *** indicate significant differences at p<0.01 and p<0.0001 (two-tailed z-test, top row: amygdala vs. OFC, z = 3.139, p = 0.002; amygdala vs. ACC, z = 4.031, p < 1e-04; OFC vs. ACC, z = 0.614, p = 0.539; middle row: amygdala vs. OFC, z = 1.517, p = 0.129; amygdala vs. ACC, z = 0.855, p = 0.393; OFC vs. ACC, z = −0.723, p = 0.470; bottom row: amygdala vs. OFC, z = 3.126, p = 0.002, amygdala vs. ACC, z = 3.411, p < 1e-03; OFC vs. ACC, z = 0.008, p = 0.994. Analysis have been performed on the entire neuronal population for each brain area: Amygdala, n=196; OFC, n = 134; ACC, n=187; see Methods). E. The proportion of neurons in each brain area that exhibit a significant response to each of the 8 viewed faces. F, Average decoding performance for each brain area for classifying monkey image (left) or fractal (right) identity (n=1000 iterations). Left, curves show the decoding performance for an 8-way classification of monkey face images (equalized number of neurons for the 3 brain areas, n=110 neurons). Right, average decoding performance for each brain structure of discriminating between the 3 fractal images (3-way classifier) (equalized number of neurons for the 3 brain areas, n=131 neurons). Shading, 95% confidence intervals (bootstrap). Dotted lines, chance decoding level. G. Average z-scored firing rate plotted as a function of hierarchical status for neurons that respond more strongly (black line and dots) or weakly (grey line and dots) to a higher ranked monkey (M1) than to a lower ranked monkey (M8) in Amygdala (left panel), OFC (center) and ACC (right). Since neural responses to M1 and M8 are used to classify the cells, these data are excluded from the regression analyses. Pearson’s correlation coefficient (two-sided): amygdala, r = −0.92, p = 0.010, n = 112 neurons (black), r = 0.82, p = 0.046, n = 83 (grey); OFC, r = −0.88, p = 0.021, n = 79 (black), r = −0.32, p = 0.538, n = 49 (grey); ACC, r = 0.19, p = 0.720, n = 97 (black), r = 0.87, p = 0.023, n = 87 (grey). Error bars, SEM. Neural responses were analyzed during the time epoch extending from 100 – 400 ms after image onset for all panels in this figure (fixation was required during this interval).
